


US Dollar and Gold Analysis
- US dollar rallies after US NFPs beat expectations by a wide margin.
- Gold slides as US rate cut expectations are pushed back.

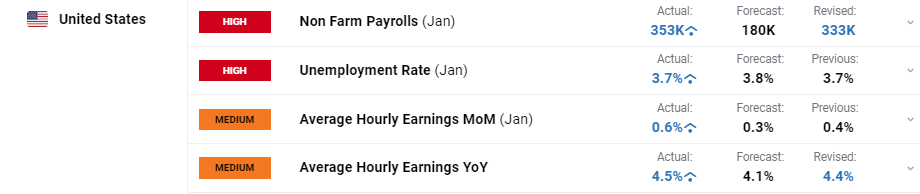
The latest US NFP release showed the US jobs market in rude health with 353k new jobs created in January compared to forecasts of 180k. Last month’s headline figure was also revised higher to 333k from 216k. The closely watched unemployment rate remained steady at 3.7%.
For all economic data releases and events see the DailyFX Economic Calendar
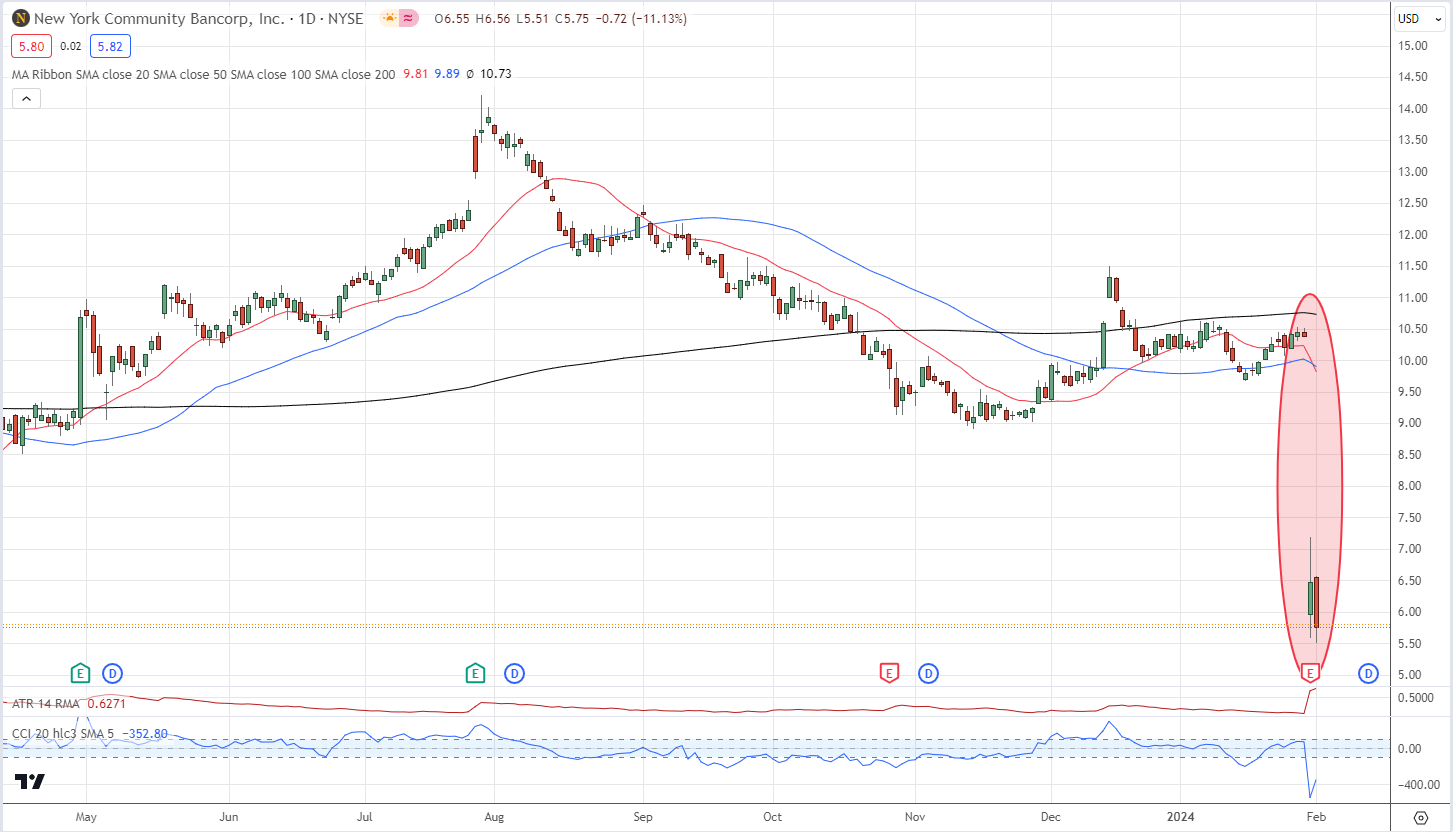
The US dollar was on the backfoot going into the Jobs Report as recent demand for US Treasuries sent their yields tumbling. Renewed US regional banking fears – shares in New York Community Bancorp slumped by around 40% on Wednesday – drove haven demand, leaving the greenback vulnerable to the downside.
New York Community Bancorp Daily Price
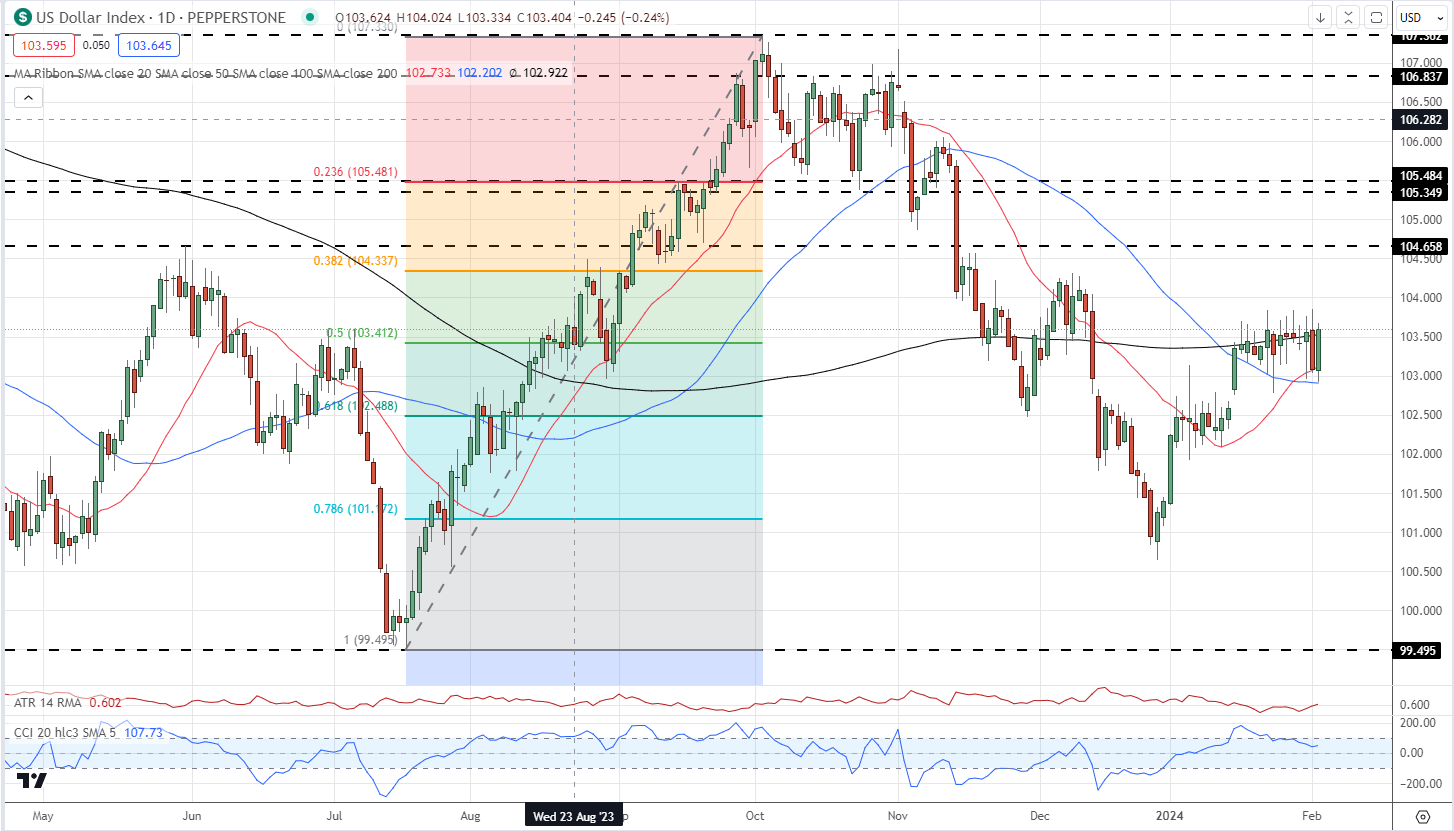
The US dollar index jumped around 50 ticks after the release hit the screens, reversing all of today’s earlier losses. The greenback remains rangebound, for now, but may soon test the 103.83/85 double highs seen over the last couple of weeks. US rate cut expectations pared post-release with less than a 20% chance now seen of a cut in March – from 35% before the release – while May expectations are now 77% compared to a high 80s earlier.
US Dollar Index Daily Chart
Gold’s recent grind higher was quickly reversed after the 13:30 release. Gold tagged $2,065/oz. yesterday, before paring gains. Gold currently trades at $2,033/oz. and is sitting on a prior level of horizontal support and both the 20- and 5-day simple moving averages. A break below here bring $2,009/oz. back into play.
Gold Daily Price Chart
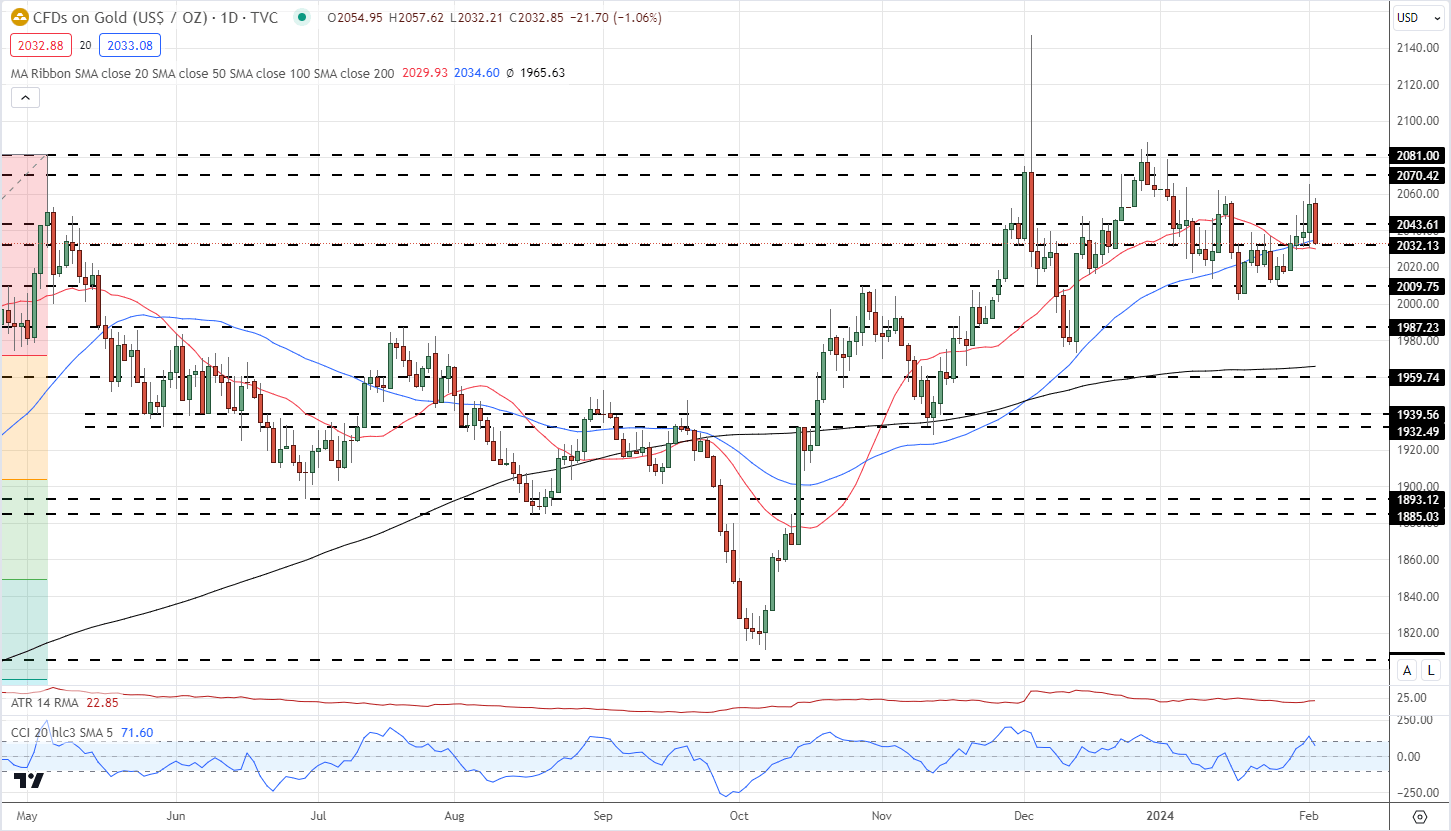
Chart via TradingView
Retail trader data show 53.45% of traders are net-long with the ratio of traders long to short at 1.15 to 1.The number of traders net-long is 4.72% lower than yesterday and 13.51% lower than last week, while the number of traders net-short is 19.02% higher than yesterday and 19.14% higher than last week.
See how daily and weekly changes in IG Retail Trader data can affect sentiment and price action.
| Change in | Longs | Shorts | OI |
| Daily | 1% | 2% | 2% |
| Weekly | 7% | -11% | -2% |
What is your view on Gold – bullish or bearish?? You can let us know via the form at the end of this piece or you can contact the author via Twitter @nickcawley1.


