US Dollar (DXY) Price, Chart, and Analysis

Financial markets are in wait-and-see mode ahead of the latest US inflation report that is due to be released today. Market volatility across most US dollar pairs is close to multi-week lows and any miss or beat may stoke some much-needed price action.
After 11 interest rate hikes since March 2022, the Federal Reserve is now seen leaving rates unchanged at the next four FOMC meetings before embarking on a rate-cutting program at the end of March next year.
CME Fed Fund Probabilities
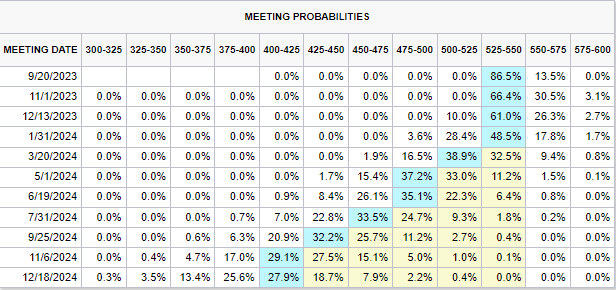
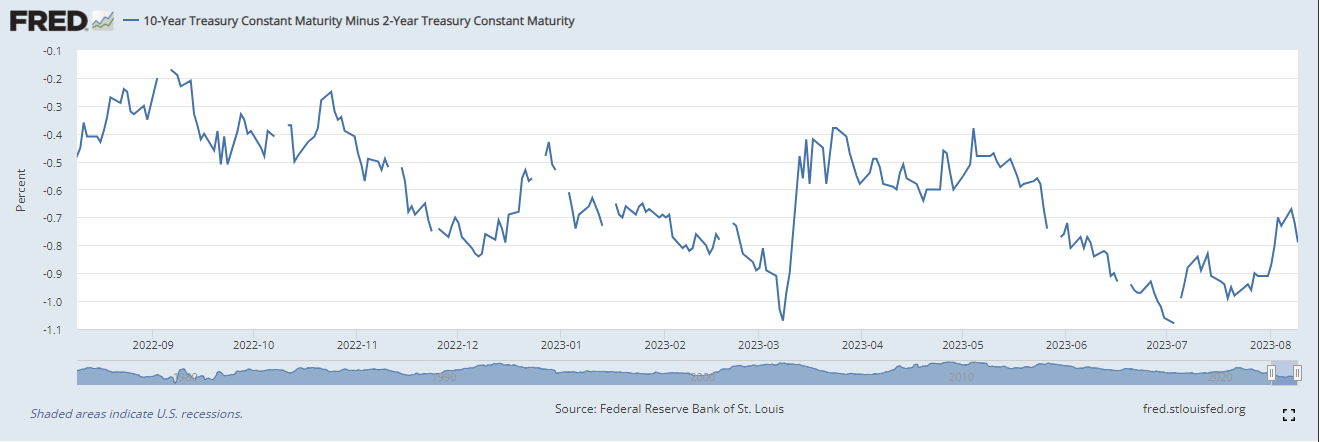
With the market now expecting interest rates to be left unchanged, the short end of the US Treasury curve has seen yields start to fall. The rate-sensitive US 2-year is now offered at 4.80% after having touched a 17-year high of 5.085% on July 6th. This fall has helped the closely-watched 2yr-10yr yield spread to pull back from a low of -110bps to a current level of -80bps. An inverted 2yr-10yr curve is seen by many as a sign of an impending recession. If the talk of a potential soft landing in the US economy gains further traction, this spread should tighten and may well turn positive in the coming months.
US 2yr-10yr Yield Curve
The latest US inflation report for July is released at 13.30 UK today and will be closely watched to see if the Federal Reserve’s rate hiking program continues to pare price pressures. While core inflation y/y is expected to remain unchanged at 4.8%, headline inflation is seen moving higher to 3.3% from 3% in June.

For all market-moving data releases and economic events see the real-time DailyFX calendar
The US dollar (DXY) remains in a range but is printing a multi-month series of lower highs as rate expectations ease. The longer-dated 200-day simple moving average is on a downward path and is capping any break higher, while the DXY is struggling to move above the 50-day sma. Volatility remains at, or very close to, a multi-month low and this is keeping price action muted. Today’s CPI report may spark some volatility but the chart suggests that the US dollar may continue to fade lower over the coming weeks.
To Find Out More About Moving Averages and How They Are Used in Trading, See the Education Module Below
Introduction to Technical Analysis
Moving Averages
Recommended by Nick Cawley
US Dollar (DXY) Daily Price Chart – August 10, 2023
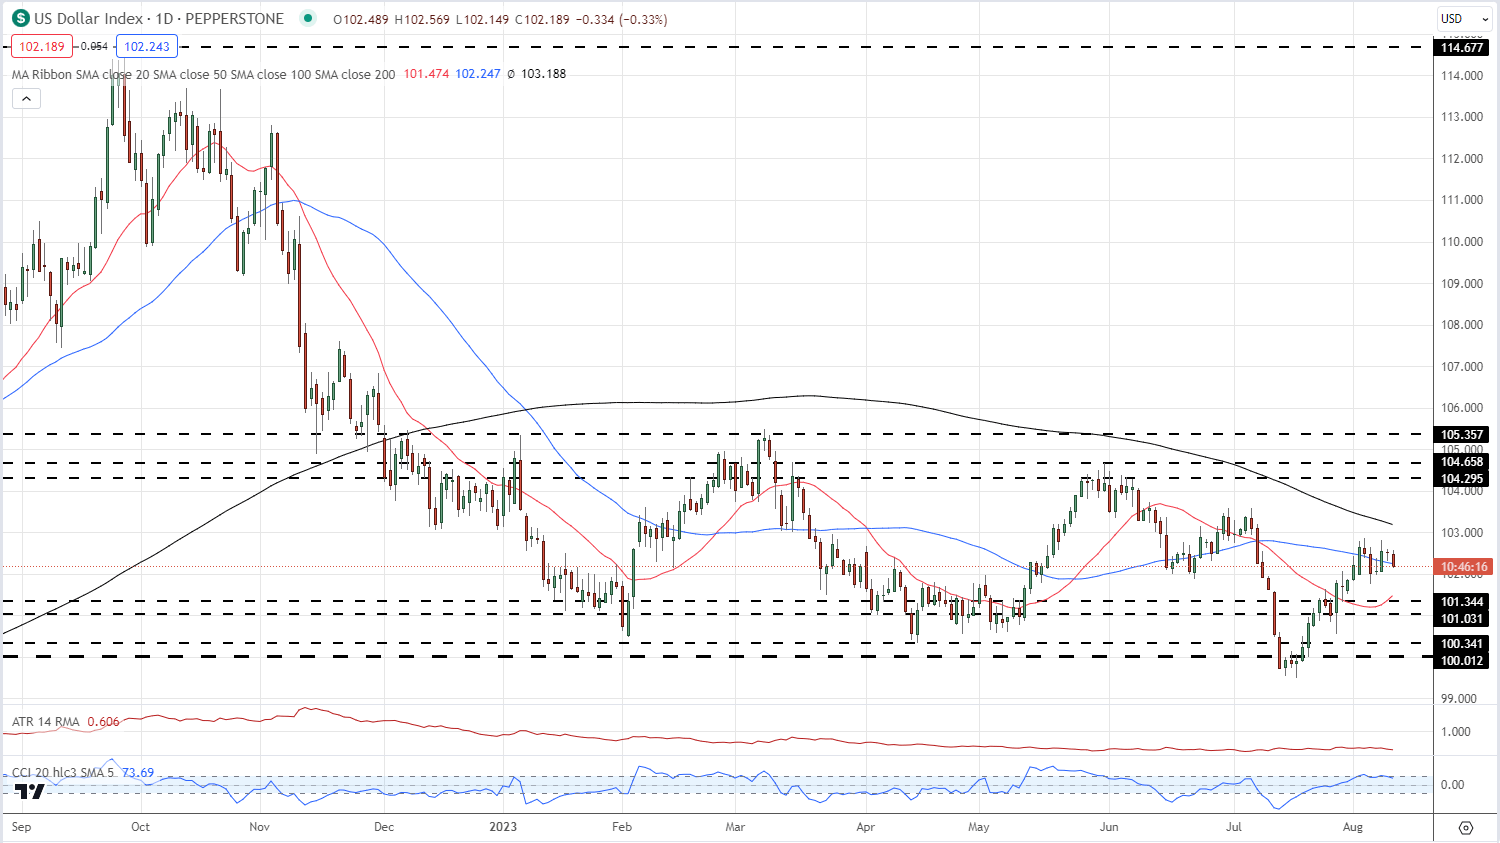
Chart via TradingView
What is your view on the US Dollar – bullish or bearish?? You can let us know via the form at the end of this piece or you can contact the author via Twitter @nickcawley1.