


Oil Prices, Charts, and Analysis
- The People’s Bank of China (PBoC) unexpectedly cut borrowing costs.
- Oil may look to consolidate recent gains.

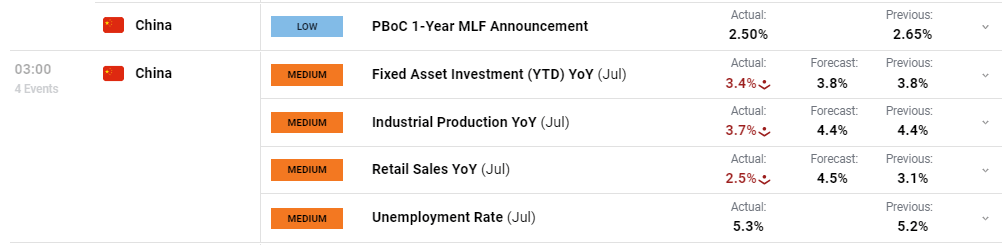
The People’s Bank of China (PBoC) unexpectedly cut its one-year medium-term lending facility – the rate at which Chinese banks borrow money from the PBoC – by 15 basis points from 2.65% to 2.50% earlier today in an effort to boost the world’s second-largest economy. This is the second rate cut in the last three months after the PBoC trimmed rates by 10 basis points in June. The nature, and size, of the cut spooked the market and fueled fears that Chinese growth is waning further. These fears were crystalized post-release as the latest set of Chinese data showed industrial production falling by more than forecast, while retail sales also turned lower. On August 21 the one-year and five-year Chinese loan rates are announced and traders need to be aware that these may also be trimmed.
For all market-moving events and economic data releases, see the real-time DailyFX Calendar
Fears that the Chinese economy is slowing down further hit risk sentiment across a wide range of markets including oil. Both US and UK oil has rallied sharply since the end of June after OPEC members decided to roll over recent output cuts. The last couple of days have seen both contracts coming off multi-month highs and a period of consolidation below last Thursday’s peak is likely.
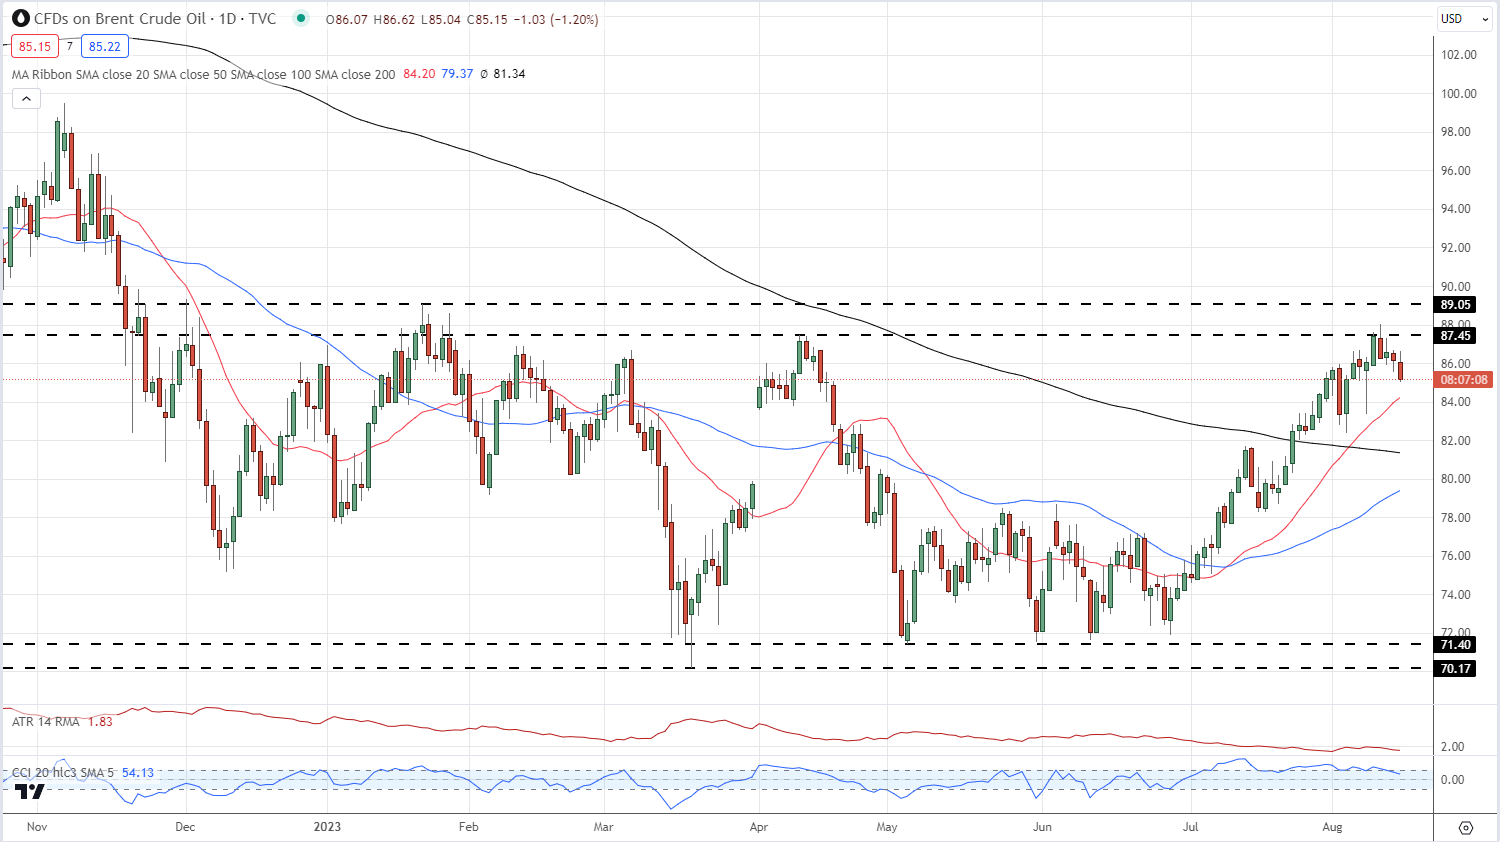
The UK oil chart remains positive with a series of higher highs and a 20-/200-day moving average crossover adding to the bullish fundamental backdrop. The short-dated moving average may act as initial support, currently at $84.20/bbl. before a short-term cluster of recent lows around $82.50/bbl. and $83.50/bbl. come into play.
An introduction on how to use moving averages
Introduction to Technical Analysis
Moving Averages
Recommended by Nick Cawley
Brent Oil Daily Price Chart – August 15, 2023
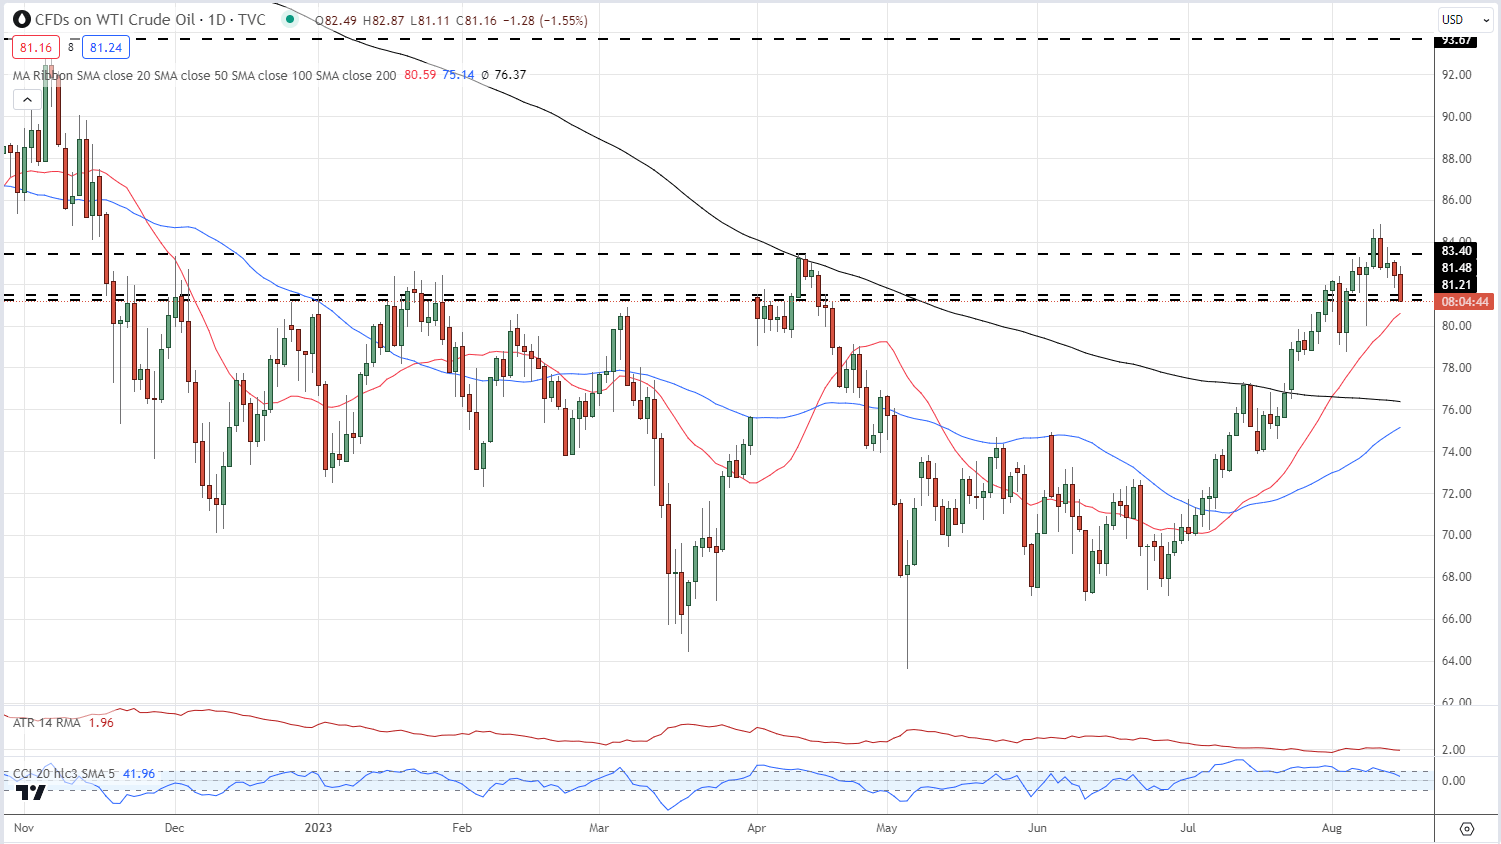
The US oil chart is testing an old level of support around $81.20/bbl. and a break below here sees $80.59/bbl. (20-dsma) ahead of $79.00/bbl.
US Oil Daily Price Chart – August 9, 2023
Charts via TradingView
Retail trader data shows the US oil trading bias is currently mixed. You can Download the Full US Oil Sentiment Report Below.
| Change in | Longs | Shorts | OI |
| Daily | -9% | 12% | -5% |
| Weekly | -6% | -6% | -6% |
What is your view on the Oil – bullish or bearish?? You can let us know via the form at the end of this piece or you can contact the author via Twitter @nickcawley1.


