
US Dollar, British Pound, Euro Vs Japanese Yen – Price Action:
- JPY on intervention watch after remarks from Japan’s top currency diplomat.
- Yield curve control tweaking should be debated – BOJ summary of opinions.
- What is the outlook for USD/JPY, EUR/JPY, and GBP/JPY?

The Japanese yen gained a bit after Japan’s top diplomat said authorities will respond to excessive moves in the currency market, and after a Bank of Japan board governor was quoted as saying the central bank should discuss revising its yield curve control policy at an early stage.
When asked about the chance of currency intervention, Japan’s top currency diplomat Masato Kanda said on Monday he would not rule out any options. USD/JPY is nearing levels which prompted intervention last year. Separately, the central bank should debate tweaking YCC to improve market function and mitigate its “high cost”, the BOJ summary of opinions at the June policy meeting released on Monday showed.
USD/JPY 240-minute Chart
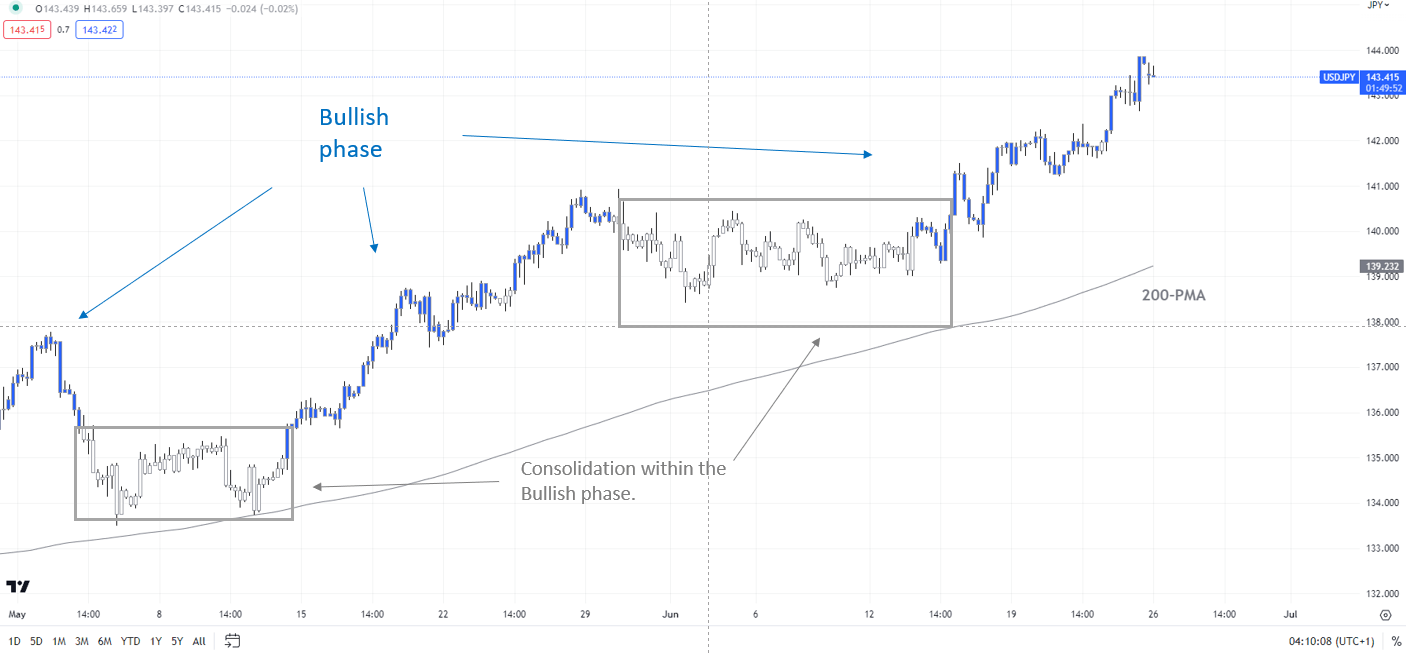
Chart Created by Manish Jaradi Using TradingView; Refer to notes at the bottom of the page.
BOJ left its ultra-loose policy settings unchanged earlier this month, especially the closely-watched yield curve control (YCC) policy, in a bid to support the nascent economic recovery and sustainably achieve its inflation goal. However, there is a growing perception that the YCC could be tweaked as soon as July given the market distortions on the yield curve. BOJ Governor Kazuo Ueda has said the central bank would ‘patiently’ maintain the current policy as there is still some way to stably and sustainably achieve its 2% inflation target.
USD/JPY Daily Chart
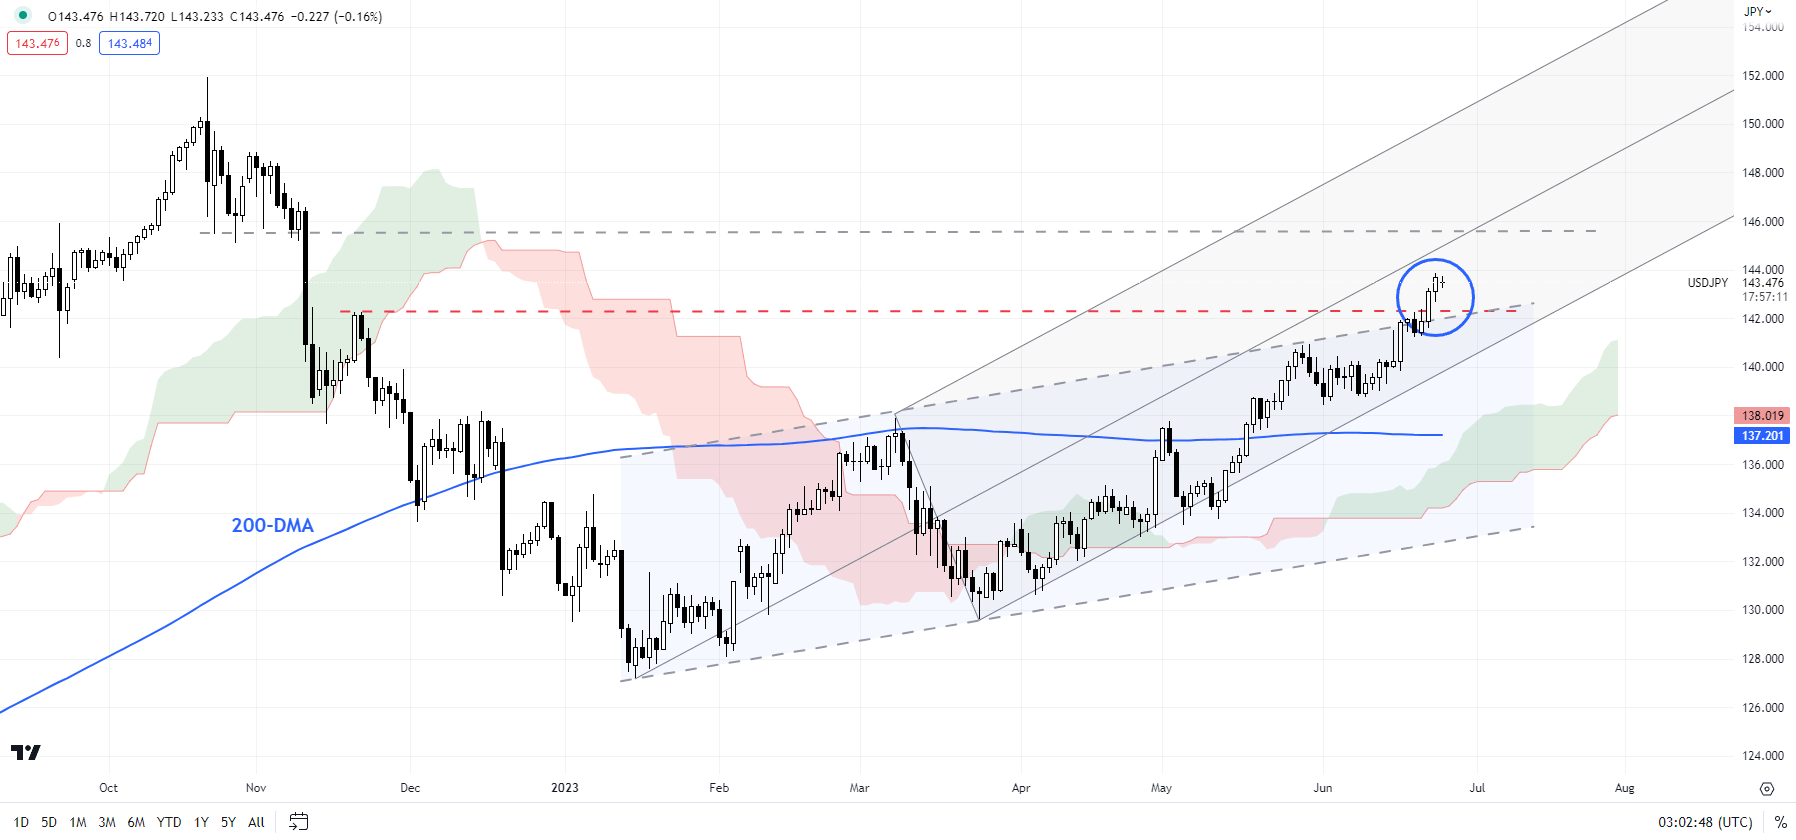
Chart Created by Manish Jaradi Using TradingView
USD/JPY:No sign of reversal
Meanwhile, USD/JPY has risen above a stiff converged resistance: the upper edge of a rising channel from early 2023, coinciding with the end-2022 high of 142.25, and is now approaching the median line of a pitchfork channel from January (at about 143.75). Some signs of loss of steam are emerging, but there is no sign of reversal yet – the colour-coded candlestick charts suggest the pair remains in a bullish phase. USD/JPY would need to fall below a key cushion at the end-May low of 141.00 for the immediate upward pressure to fade.
EUR/JPY Monthly Chart
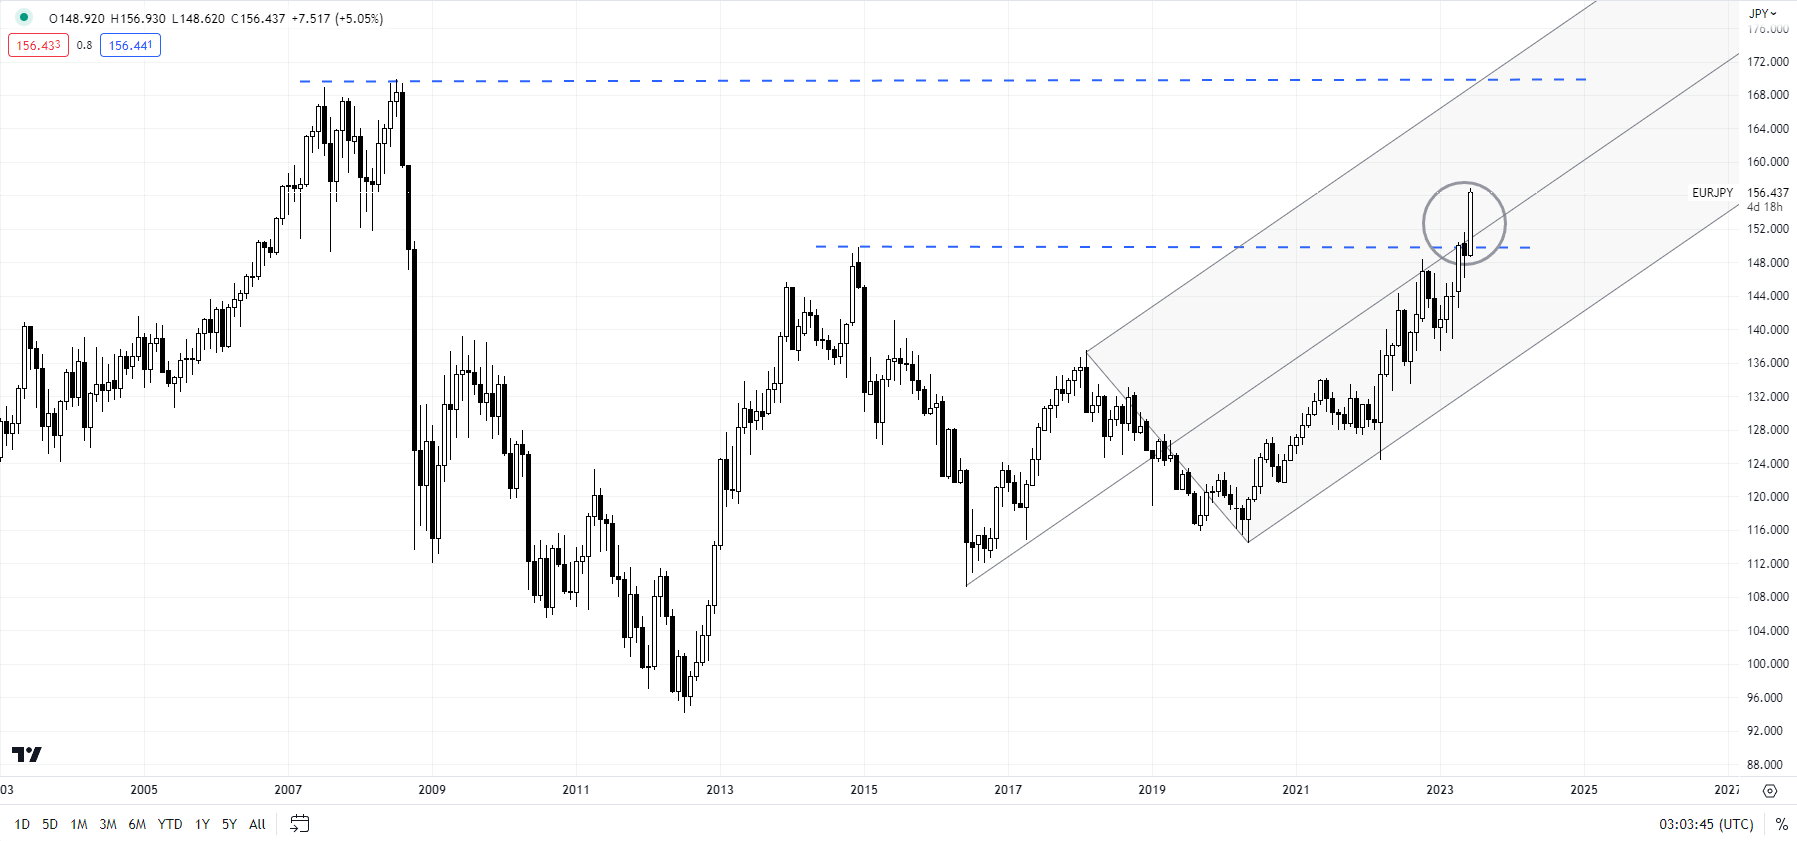
Chart Created by Manish Jaradi Using TradingView
EUR/JPY: Is it breaking above resistance?
EUR/JPY has risen above a vital converged barrier at the 2014 high of 149.75, coinciding with the median line of a pitchfork channel from 2016. A decisive break (two monthly closes) above could open the door toward the 2008 high of 170.00. If the cross manages to close this month above the resistance, it would raise such odds. However, a poor close (e.g. if the crosses retraces a large part of this month’s gains) would raise the odds of a false break higher.
GBP/JPY Monthly Chart
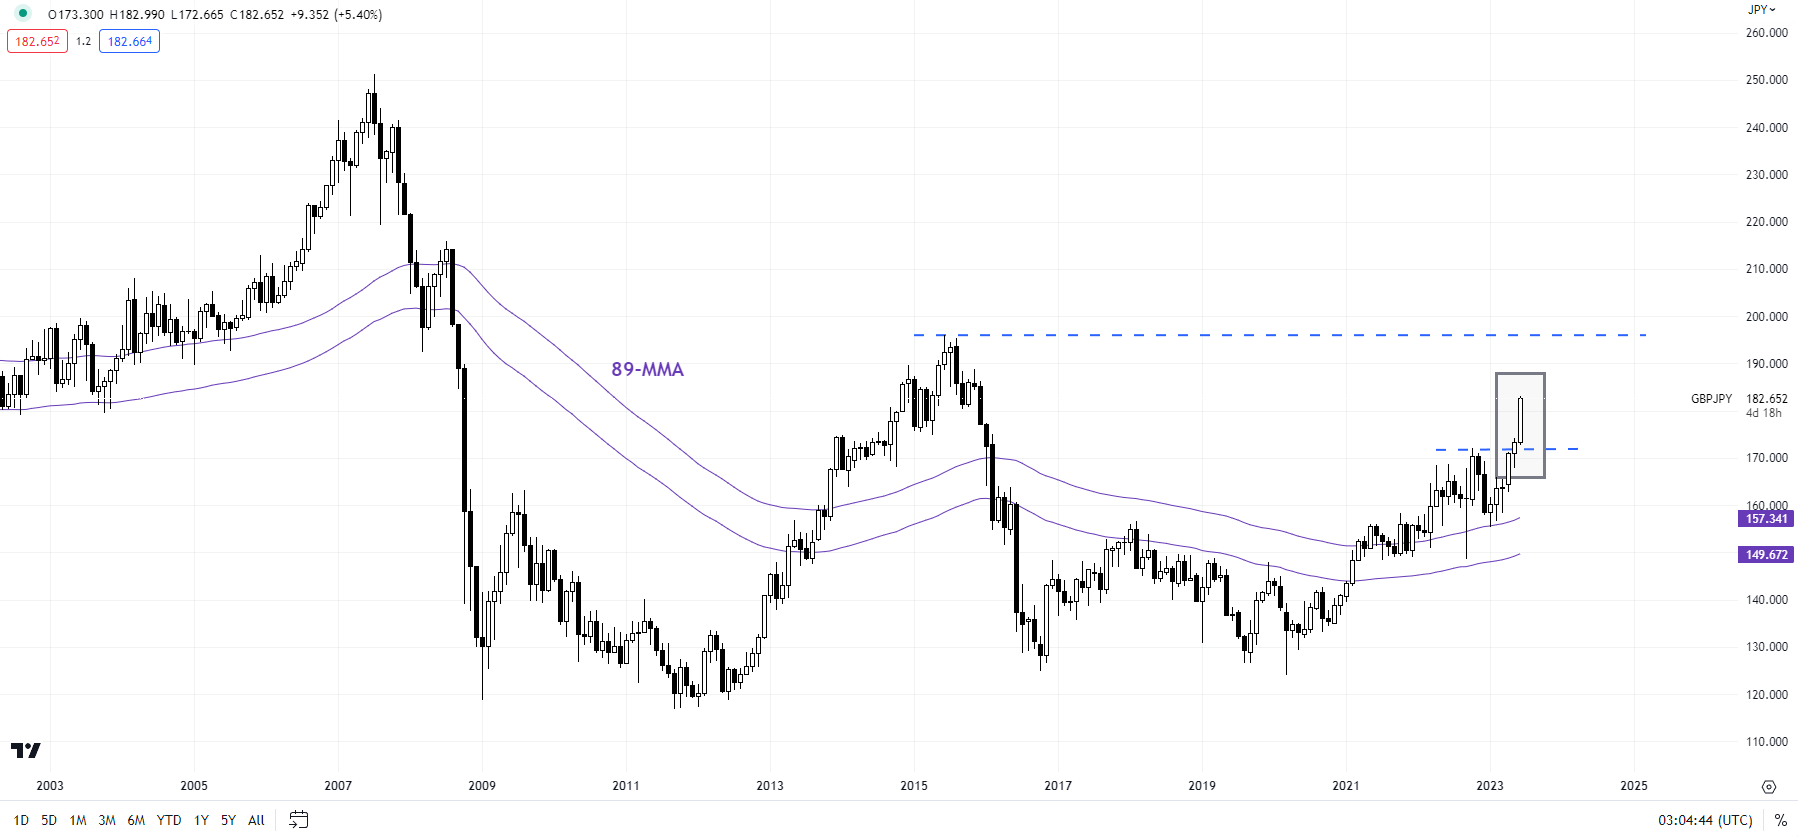
Chart Created by Manish Jaradi Using TradingView
GBP/JPY: Strong upward momentum
GBP/JPY appears to be headed toward the 2022 high of 172.15 following the break above the median line of a pitchfork channel since February. For more discussion see “Japanese Yen Drops After FOMC: Price Setups in USD/JPY, AUD/JPY, GBP/JPY”, published June 15.
Note: The above colour-coded chart(s) is(are) based on trending/momentum indicators to minimize subjective biases in trend identification. It is an attempt to segregate bullish Vs bearish phases, and consolidation within a trend Vs reversal of a trend. Blue candles represent a Bullish phase. Red candles represent a Bearish phase. Grey candles serve as Consolidation phases (within a Bullish or a Bearish phase), but sometimes they tend to form at the end of a trend. Candle colors are not predictive – they merely state what the current trend is. Indeed, the candle color can change in the next bar. False patterns can occur around the 200-period moving average, or around a support/resistance and/or in sideways/choppy market. The author does not guarantee the accuracy of the information. Past performance is not indicative of future performance. Users of the information do so at their own risk.
Trade Smarter - Sign up for the DailyFX Newsletter
Receive timely and compelling market commentary from the DailyFX team
--- Written by Manish Jaradi, Strategist for DailyFX.com
--- Contact and follow Jaradi on Twitter: @JaradiManish