


Gold Price (XAU/USD) Analysis, Price, and Chart
Learn How to Trade Gold for Free

A stronger US dollar, bolstered by rising US Treasury yields, is pressing down on gold and sending it down to levels last seen over one month ago. The precious metal is also just $20 away from making a fresh multi-month low and if this happens, the technical outlook for the precious would turn further bearish.
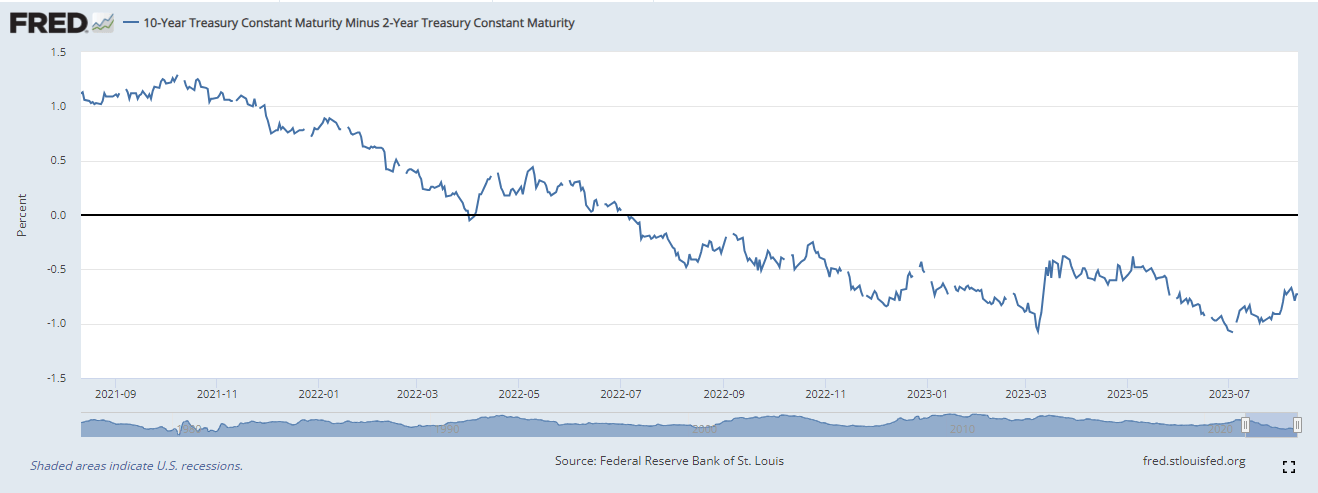
The US dollar continues to push higher, aided by higher US Treasury yields. While the short end of the curve is little changed, and pricing in unchanged rates over the coming months, the longer end of the curve is seeing higher yields. The 2-10 year curve remains inverted by around 73 basis points and as the possibility of a US recession recedes, the yield curve differential will move further towards flat.
This week’s economic calendar will likely have little impact on the price of gold until the FOMC Minutes are released on Wednesday at 19:00 UK. After this release, the economic calendar goes quiet. Traders will need to monitor the ongoing real estate slump in China. Shares in Chinese property giant Country Garden Holdings fell to a record low today after the company missed bond coupon payments last week and warned that it faces challenges ahead. Country Garden Holdings shares fell by 18% overnight in Hong Kong, sparking fears of another Evergrande-style default.
Learn from Other Trader's Mistakes - Get Your Free Trading Mistakes Guide

The daily gold chart shows the precious metal near the 200-day simple moving average at $1,904/oz. This longer-dated ma has provided support for gold since mid-December last year. Just below here, is the 38.2% Fibonacci retracement level at $1,903.4/oz. can be seen before the $1,900/oz. the psychological level comes into view. A break below would leave the June 29 $1,893/oz. multi-month low vulnerable.
If gold gets a safe-haven bid, possibly driven by Country Garden, then a break higher will be met by a series of prior lower highs made over the last month. These may prove difficult to overcome in the short term.
Volatility also remains low in the precious metal - along with a number of other markets - and this makes any sharp price moves less likely.
Gold Daily Price Chart – August 14, 2023
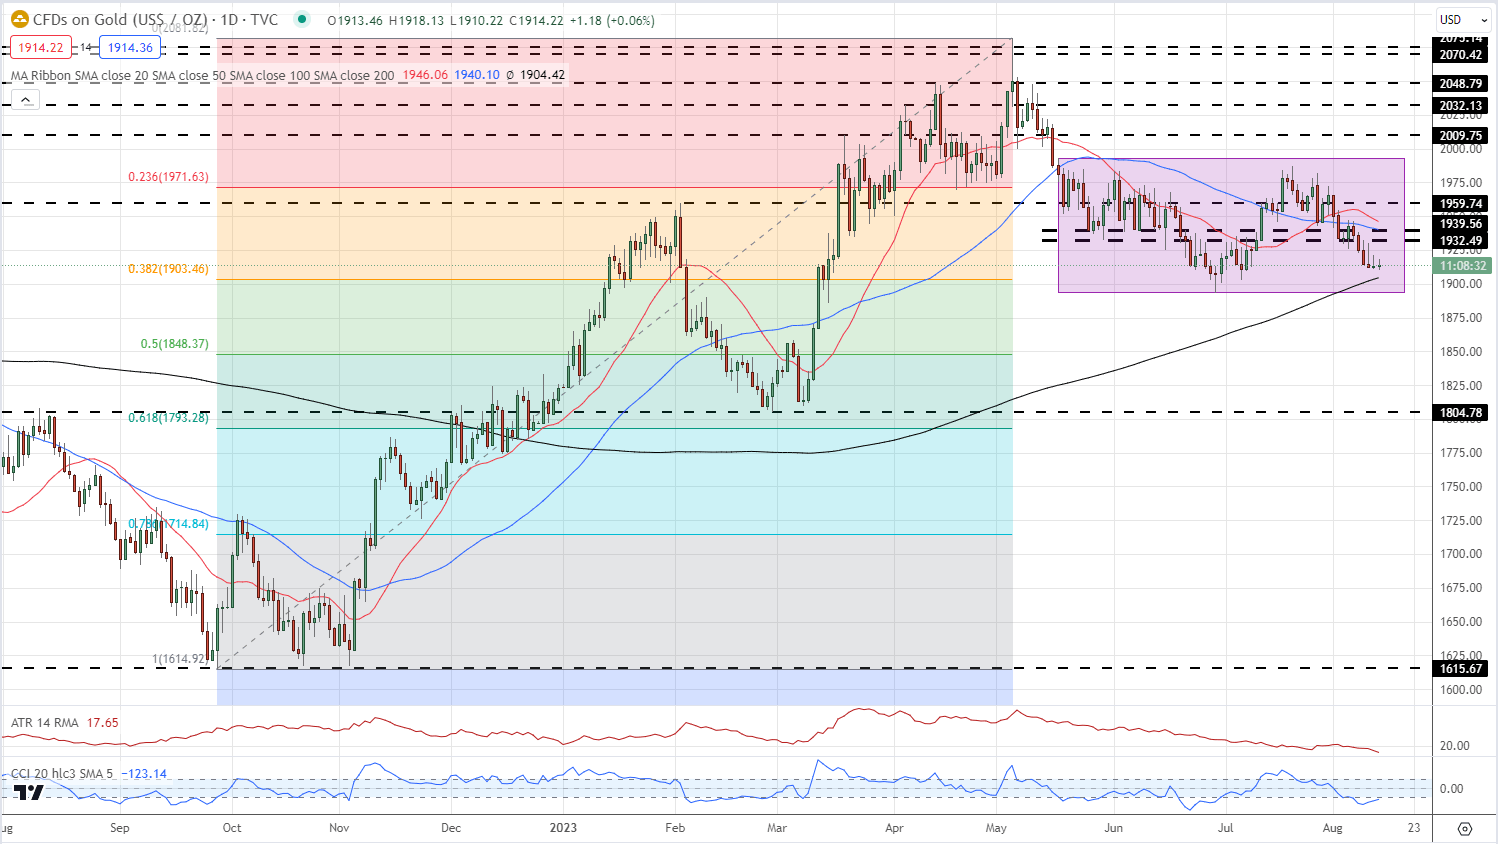
Chart via TradingView
Gold Client Sentiment
Retail traders are 79.77% net-long of Gold with the ratio of traders long to short at 3.94 to 1.
| Change in | Longs | Shorts | OI |
| Daily | 14% | -6% | 3% |
| Weekly | -14% | 11% | -4% |
What is your view on Gold and Silver – bullish or bearish?? You can let us know via the form at the end of this piece or you can contact the author via Twitter @nickcawley1.


