


Gold (XAU/USD) Analysis, Prices, and Charts
- Middle East conflict boosts gold allure.
- Retail traders remain heavily long of gold.
Download our Brand New Q4 Gold Guide for Free

Violence erupted in the Middle East over the weekend after Palestinian Islamist militant group Hamas attacked Israel with the current death toll in excess of 700 according to recent reports. In response, Israel attacked Hamas targets in the Gaza Strip with over 400 deaths being reported. The long-running conflict between the two shows no signs of abating, despite global condemnation, leaving markets vulnerable to further bouts of volatility. The US dollar has moved higher in early turnover, oil is around 3% to 4% to the good, while traditional haven currencies including the Japanese Yen and the Swiss Franc are better bid.
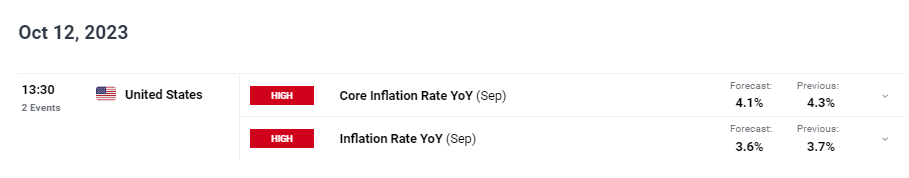
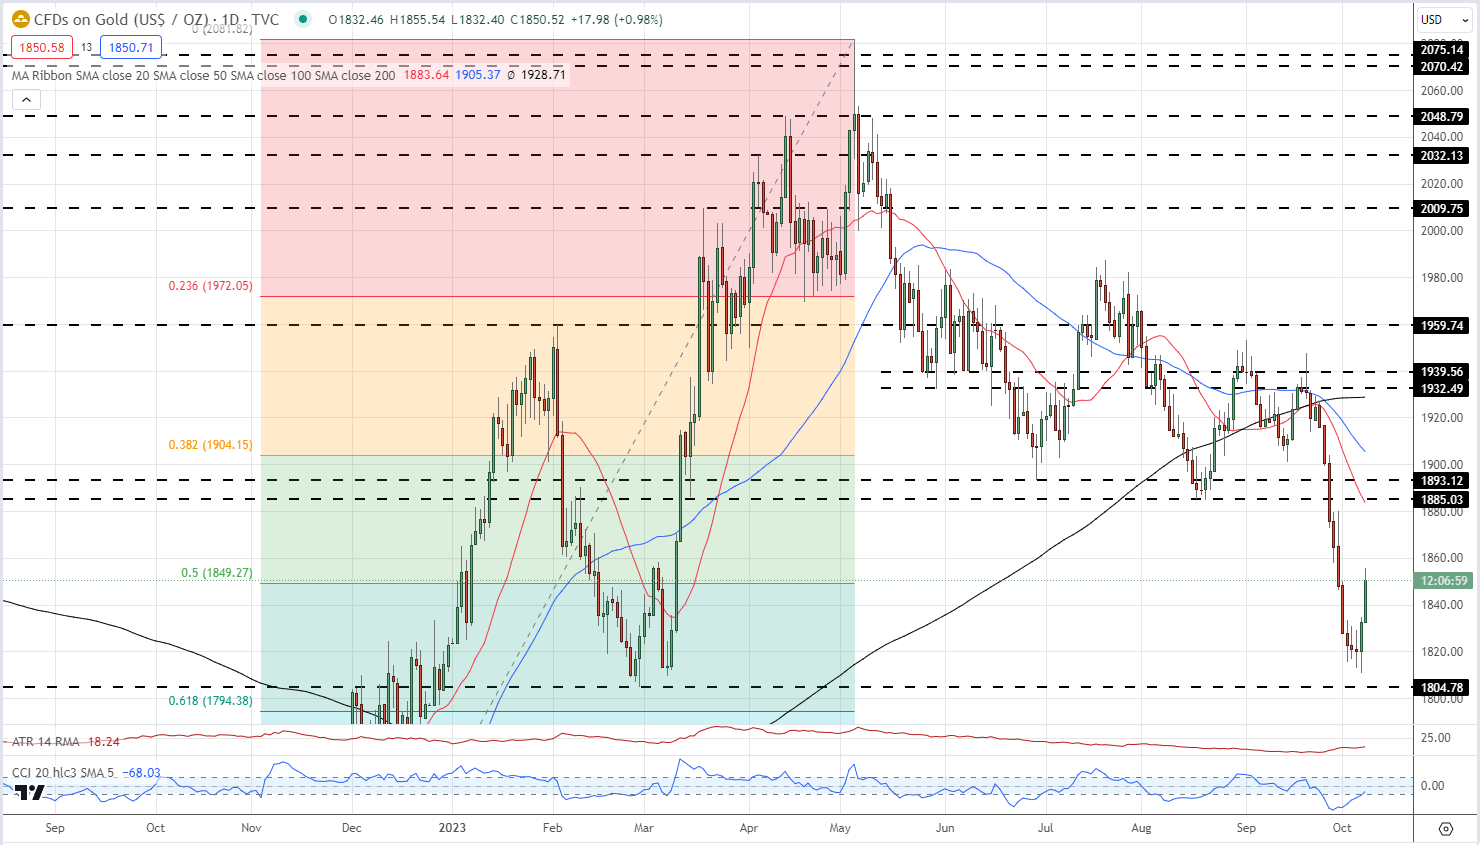
The conflict in the Middle East has seen gold move sharply higher, building upon Friday’s post-NFP rally. The move late last week broke a short-term bearish pennant pattern and stopped the precious metal from testing support just above $1,800/oz. While the headline NFP number was much larger than expected, a tick lower in average hourly earnings will have pleased the Fed as they continue their fight against inflation. The latest US inflation report is released on Thursday and is expected to show both core and headline inflation moving lower.
Learn How to Trade Gold

Today’s move will give bulls renewed hope that a resistance zone on, either side of $1,890/oz. may soon be tested, although all three simple moving averages will weigh on any move higher. The 50% Fibonacci retracement level at $1,849/oz. is currently in play and if this holds then further upside may be seen.
Gold Daily Price Chart – October 9, 2023
Retail traders are heavily long of gold, according to the latest IG sentiment report, with around 85% holding a long position. Daily changes need to be followed due to the unfolding conflict as this can affect sentiment going forward.
| Change in | Longs | Shorts | OI |
| Daily | -12% | 5% | -5% |
| Weekly | -9% | 2% | -4% |
Charts via TradingView
What is your view on Gold – bullish or bearish?? You can let us know via the form at the end of this piece or you can contact the author via Twitter @nickcawley1.


