


For a complete overview of gold and silver’s technical and fundamental outlook for the coming months, make sure to grab your complimentary Q1 trading forecast now!

Patience Required Ahead of Bullish Continuation
From a technical standpoint the bullish outlook on gold is a little more complicated than the fundamental thesis suggests. A lot of positive momentum has already been priced in, providing a less impressive risk-to-reward ratio.
It is with this in mind that an extended pullback would be favourable prior to assessing bullish continuation setups. The first level of support that could provide a springboard for gold is the zone around $2010, with a deeper pullback highlighting $1956. The medium-term uptrend has provided notable periods where gold prices cooled before continuing higher and therefore, it would be reasonable to foresee the potential for another pullback developing in Q1 of 2024.
To the upside, levels of interest appear at $2075 and if price action can muster up enough momentum, a retest of the new all-time-high of $2146.79 appears as the next level of resistance. This trade idea requires discipline to wait for a better entry into what remains a bullish trend.
Gold (XAU/USD) Weekly Chart
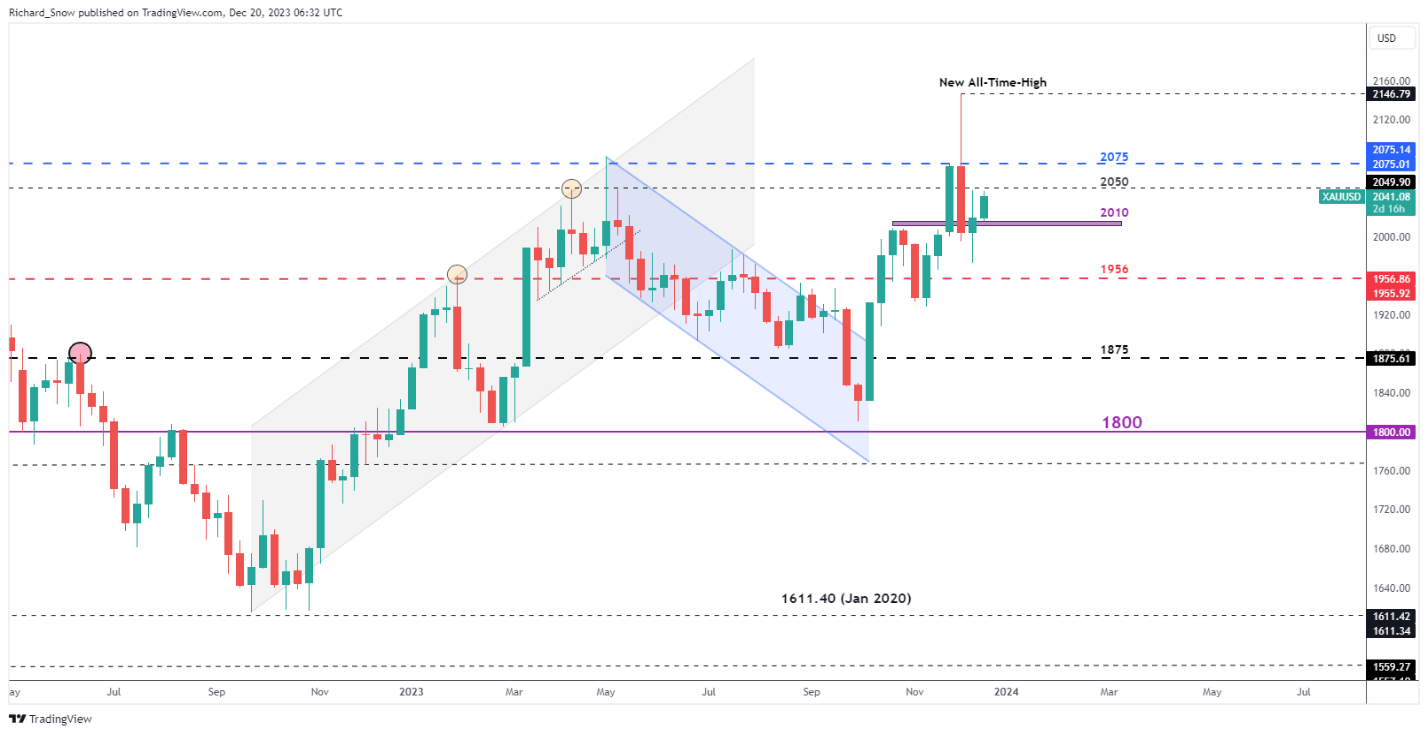
Source: TradingView, Prepared by Richard Snow
Wondering how retail positioning can shape silver prices? Our sentiment guide provides the answers you seek—don't miss out, download it now!
| Change in | Longs | Shorts | OI |
| Daily | 2% | -6% | 0% |
| Weekly | 7% | -19% | 1% |
Silver Appears Less Responsive to Bullish Sentiment Ahead of Q1
Silver, unlike gold, failed to register a new all-time high and even missed out on printing a new yearly high. As such silver plays the part of the laggard when assessing the likelihood of a bullish advance in the first quarter of 2024.
Silver broke out of the prior descending channel only to drop back within it again and as 2023 draws to a close, another upside breakout appears on the cards trading around the 50% Fibonacci retracement of the major 2021 to 2022 decline at $23.85.
As with gold, a pullback would offer a better entry level, highlighting the 38.2% Fibonacci retracement level of $22.35 or even $21.43 as potential launchpads for a move higher.
The prior level of resistance at $25.00 flat provides one potential key level to the upside with $26.10 having capped weekly prices throughout 2023. The $25 level has also come into play, halting bulls at the back end of 2021 and in September this year.
Weekly Silver (XAG/USD) Chart
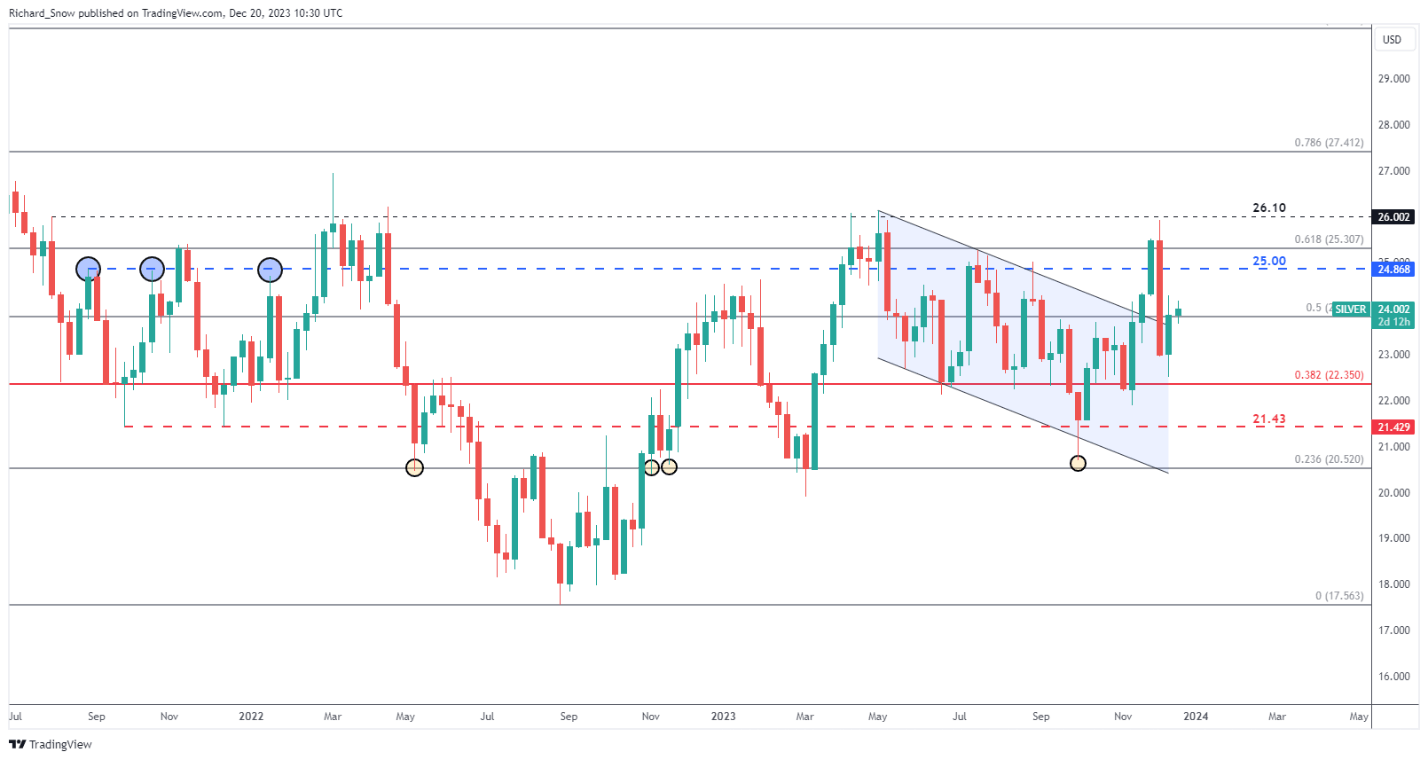
Source: TradingView, Prepared by Richard Snow


