


Gold, XAU/USD, Silver, XAG/USD – Outlook:
- Precious metals continue to be weighed by rising real yields.
- Silver risks a bearish triangle while gold is holding above key support.
- What is the outlook and what are the key levels to watch in XAU/USD and XAG/USD?

Precious metals are in search of some positive catalysts, and the sector is looking to US real yields for some reprieve.
Gold: Weighed by resistance
On technical charts, after a brief rebound from strong converged support in August, gold has retreated from vital resistance on the upper edge of the Ichimoku cloud on the daily charts and the 89-day moving average. The recent turn lower has raised the odds of a lower-highs-lower-lows sequence since May. For this bearish pattern to reverse, the yellow metal would need to, at minimum, rise above the early-September high of 1952.
Gold Vs US 10-year TIPS

Chart Created by Manish Jaradi Using TradingView
With the US Federal Reserve unwilling to commit it is done with hiking rates, there is very little incentive for yields to fall meaningfully amid a resilient economy. US real yields continue to hover around multi-month highs hit in August. Rising nominal interest rates coupled with easing price pressures/inflation expectations have pushed up real rates, raising the opportunity cost of holding the zero-yielding yellow metal. See “High Real Yields Starting to Bite Gold? XAU/USD Price Setup Ahead of US CPI,” published August 10.
XAU/USD Daily Chart
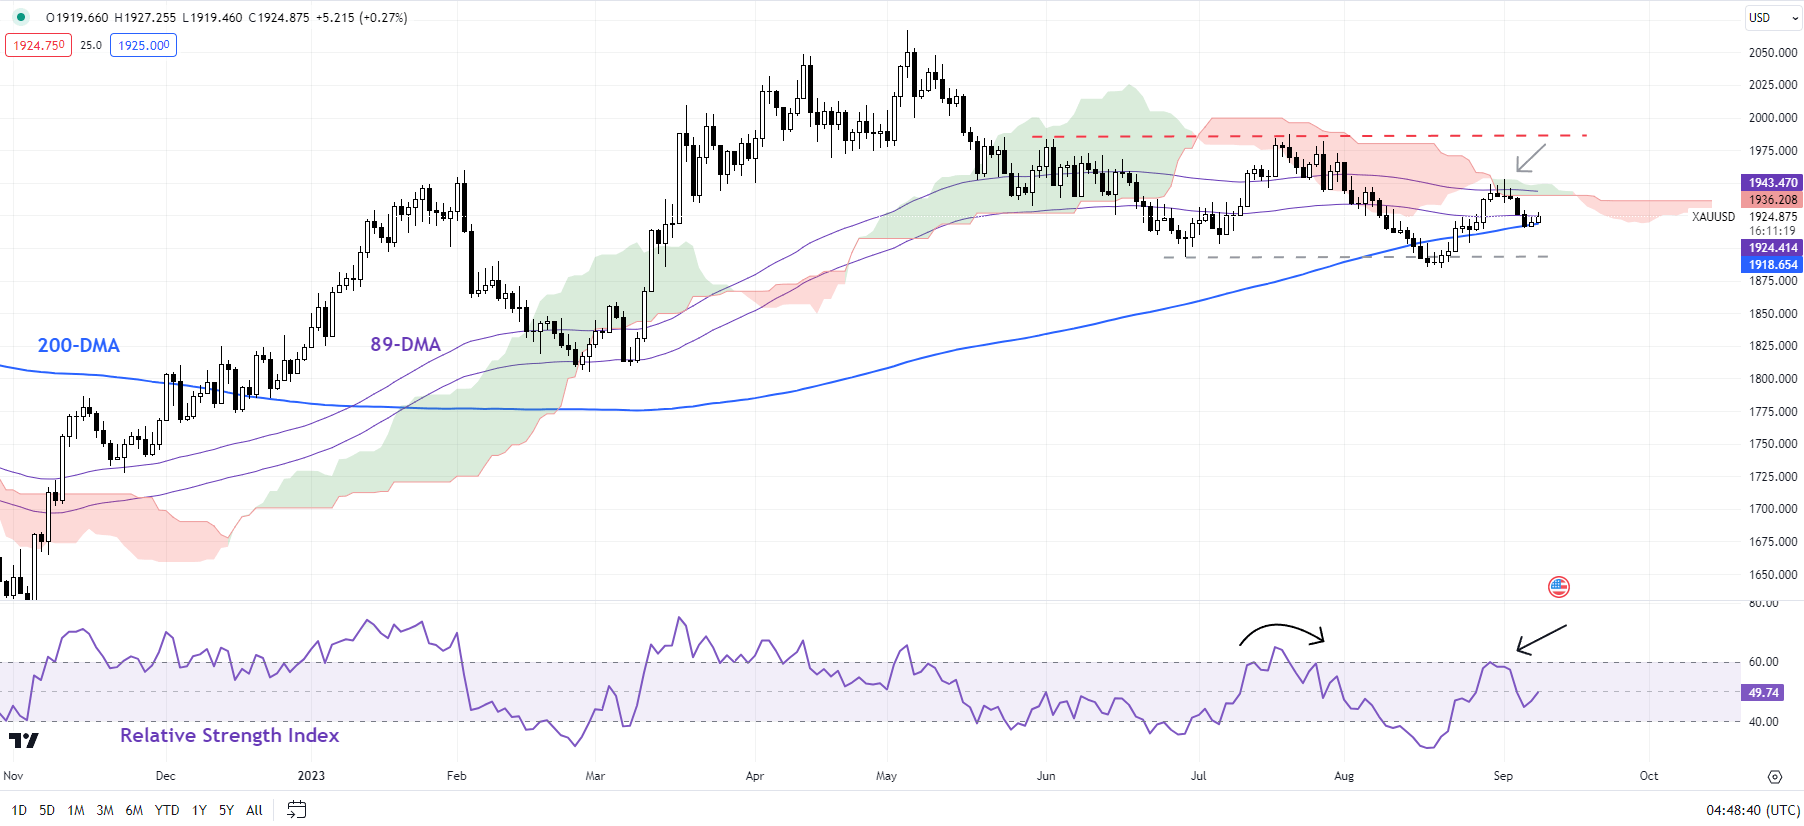
Chart Created by Manish Jaradi Using TradingView
The yellow metal rebounded last month from quite strong support on the 200-day moving average and the June low of 1890. See “Gold, Silver Forecast: It’s Now or Never for XAU/USD, XAG/USD,” published August 13. This was associated with a brief reprieve lower in US real yields, also as data released in the second half of August failed to match up with overly optimistic expectations (the US Economic Surprise Index hit a two-year high at the end of July before cooling off).
XAU/USD Monthly Chart
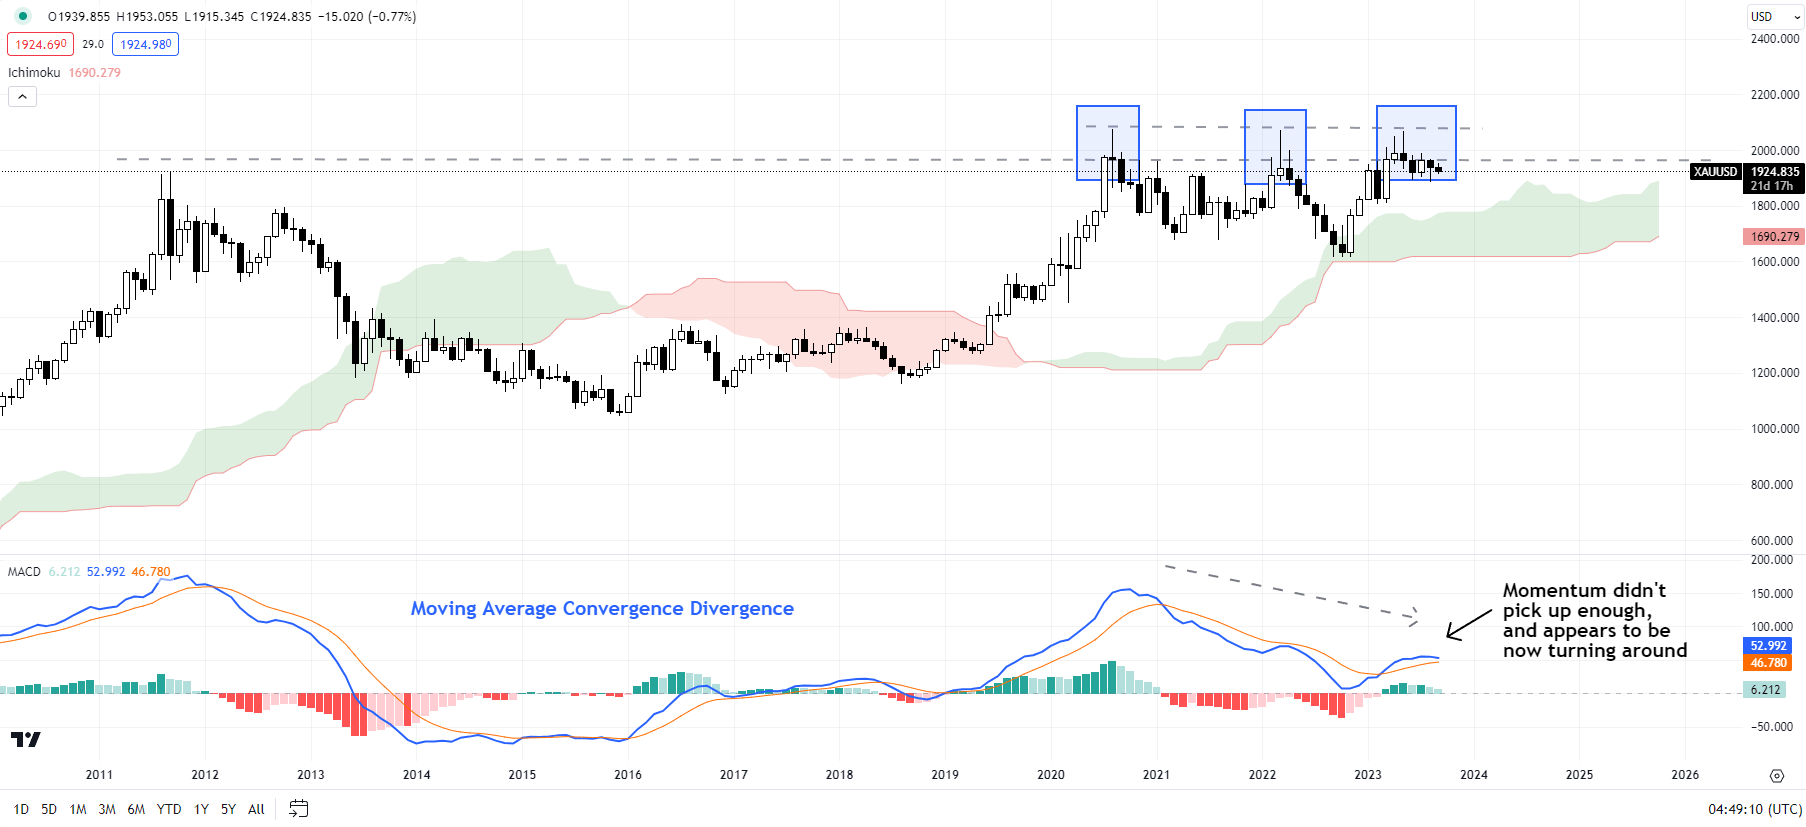
Chart Created by Manish Jaradi Using TradingView
A failure to clear past 1952 could push gold back toward crucial support on the 200-day moving average and the June/August low of 1885-1890. The importance of this support was highlighted in “Gold, Silver Forecast: It’s Now or Never for XAU/USD, XAG/USD,” published on August 13. Any break below could pave the way toward the February low of 1805. Importantly, any break below 1885-1890 would truncate the uptrend that began in 2022.
XAU/USD Weekly Chart

Chart Created by Manish Jaradi Using TradingView
Importantly, it would raise the odds that the spectacular multi-month rally was corrective and not the start of a new uptrend – a point highlighted in recent months. See “Gold Could Find It Tough to Crack $2000”,published March 28, and “Gold Weekly Forecast: Is it Time to Turn Cautious on XAU/USD?” published April 16.
XAG/USD Weekly Chart
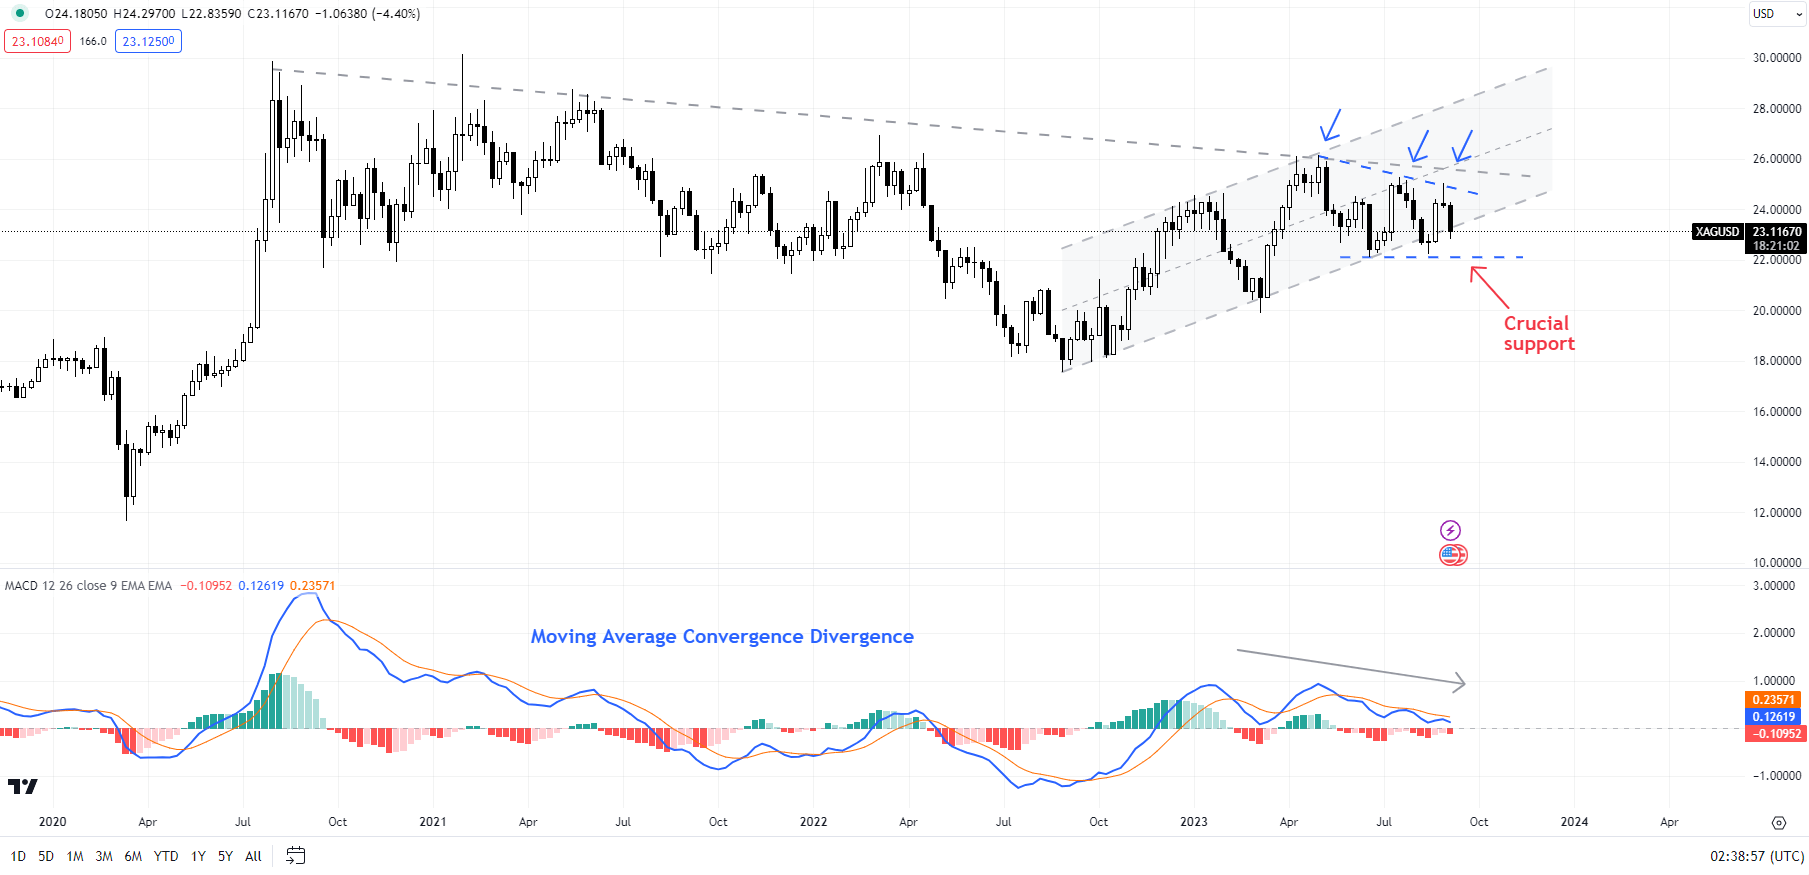
Chart Created by Manish Jaradi Using TradingView
Silver: A bearish triangle setup?
Silver’s failure to rise past stiff resistance on a declining trendline since 2020 coupled with another down trendline since Q2-2023 makes it vulnerable to a move lower. Any break below immediate support on a horizontal trendline at about 22.00 would trigger a bearish triangle with a potential price objective toward the October low of 19.80. Any break below 19.80 would suggest that the rally since 2022 has reversed. Subsequent support is at the 2022 low of 17.50.

--- Written by Manish Jaradi, Strategist for DailyFX.com
--- Contact and follow Jaradi on Twitter: @JaradiManish


