

GOLD PRICE OUTLOOK – XAU/USD TECHNICAL ANALYSIS
- Gold prices have lacked directional conviction this year, with bullion seemingly in a consolidation phase awaiting fresh catalysts
- Next week's U.S. inflation data may be a source of market volatility and could help guide precious metals in the near term
- This article examines XAU/USD’s technical outlook, analyzing key price thresholds to monitor over the coming trading sessions
Most Read: US Dollar Forecast - Seeking New Drivers; Setups on EUR/USD, USD/CAD, AUD/USD
Gold (XAU/USD) has lacked directional conviction since the beginning of 2024, with prices oscillating between technical resistance at ~$2,065 and horizontal support at ~$2,005. Although bullion’s prospects seemed more positive a month ago, the bullish thesis appears to be on hold for now, especially after the Federal Reserve indicated that it is in no hurry to start lowering borrowing costs.
If rates remain at elevated levels or even rise further, precious metals, which do not pay dividends or offer yields, will struggle to follow an upward trajectory. With the interest rate outlook front and center these days, the FOMC’s monetary policy path will perhaps be the most important catalyst driving market dynamics in the near term.
Burned by false dawns before and fearful of complicating efforts to restore price stability, the U.S. central bank has resisted pressure to start cutting rates imminently. This pushback could be validated if the upcoming consumer price index report, due for release next week, reveals limited progress toward disinflation.
In terms of Wall Street projections, January headline CPI is forecast to have moderated to 3.1% y-o-y from 3.4% y-o-y in December. In contrast, the core gauge—a measure of long-term and underlying price trends in the economy—is seen cooling in a more gradual fashion, easing only to 3.8% y-o-y from 3.9% y-o-y previously.
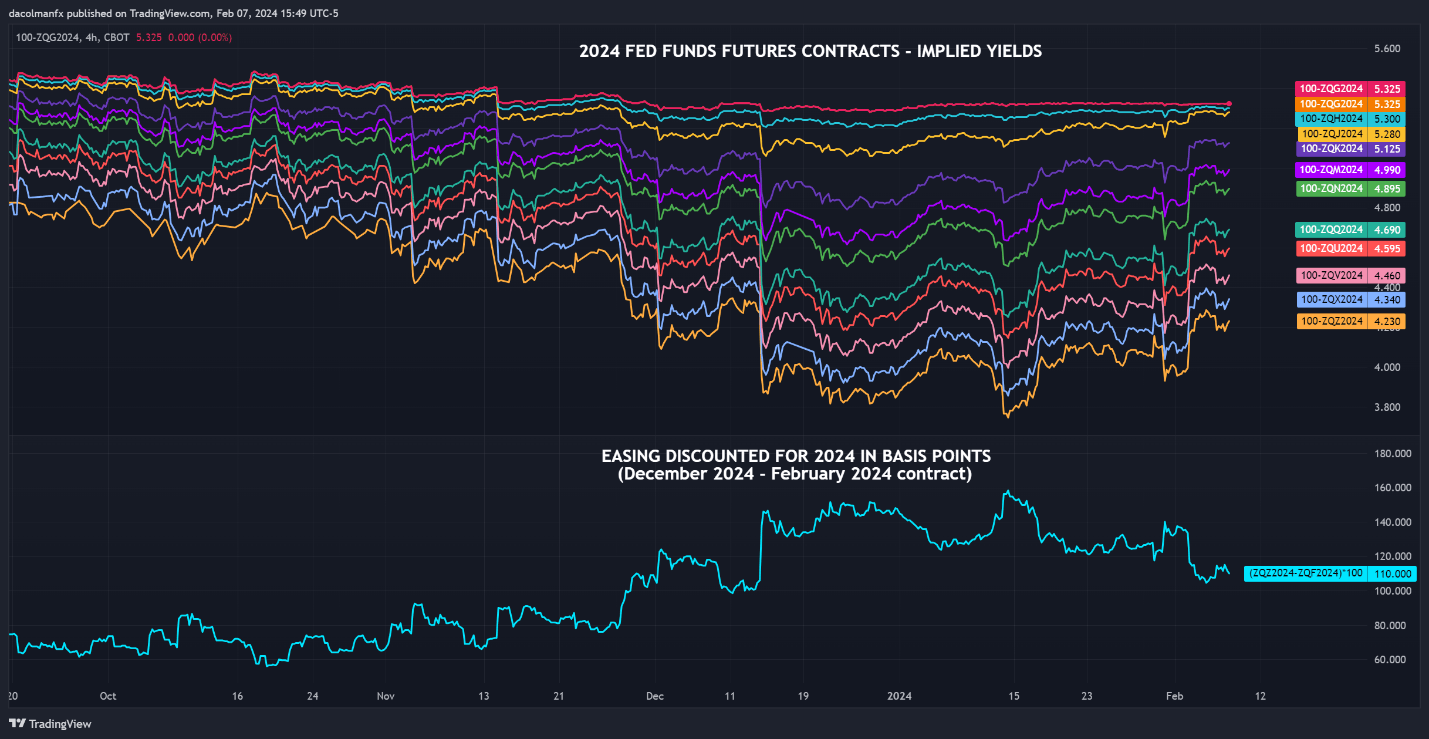
Focusing on potential outcomes, any upside surprise in the official CPI numbers relative to consensus estimates, particularly in the core metrics, should be bearish for gold. This scenario is likely to induce traders to scale back dovish interest rate expectations, which currently envision 110 basis points of easing through year’s end, boosting yields and the U.S. dollar in the process.
For an extensive analysis of gold’s medium-term prospects, download our complimentary Q1 trading forecast now!

FED FUNDS FUTURES CONTRACTS – IMPLIED YIELDS
Meanwhile, lower-than-forecast inflation readings should be positive for the yellow metal. A large enough miss could even motivate markets to increase bets that the first rate-cut will come at the March meeting. In this case, U.S. Treasury yields, along with the U.S. dollar, may head lower while risk assets could experience a favorable turn.
Wondering how retail positioning can shape gold prices? Our sentiment guide provides the answers you are looking for—don't miss out, get the guide now!
| Change in | Longs | Shorts | OI |
| Daily | -13% | 7% | -4% |
| Weekly | -7% | 3% | -2% |
GOLD PRICE TECHNICAL ANALYSIS
Gold prices (XAU/USD) were somewhat subdued on Wednesday, moving aimlessly and consolidating around the 50-day simple moving average at $2,035, perhaps in quest of fresh market catalysts. The ongoing consolidation phase is not likely to end until prices either clear resistance at $2,065 or take out support at $2,005 decisively.
In the event of a resistance breakout, the focus will be squarely on $2,085. From there, further gains may lead to renewed interest in the all-time high in the vicinity of $2,150. Meanwhile, a breach of support could spark a pullback towards $1,990. Additional losses past this threshold could bring attention to the 200-day simple moving average near $1,995.
GOLD PRICE (XAU/USD) TECHNICAL CHART