
GOLD PRICE OUTLOOK
- Gold prices turn lower following hotter-than-expected U.S. CPI data
- Sticky inflationary pressures boost Treasury yields and the U.S. dollar, creating a challenging environment for precious metals
- This article looks at XAU/USD’s key technical levels worth keeping an eye on over the coming trading sessions
Trade Smarter - Sign up for the DailyFX Newsletter
Receive timely and compelling market commentary from the DailyFX team
Most Read: Oil Price Forecast - Geopolitical Turmoil to Spur Bullish Energy Market Sentiment
Gold prices (XAU/USD), which hit multi-month lows last week, embarked on a modest recovery in recent days. Earlier on Thursday, bullion rose to its highest point since September 27 ($1,885). However, this upward momentum was abruptly halted by the release of U.S. inflation data, which exceeded forecasts. For context, September's headline CPI increased by 0.4% month-over-month and 3.7% year-over-year, surpassing estimates by a tenth of a percent in both cases.
Sticky inflationary pressures have reignited bullish momentum for U.S. yields, following a brief period of softness, paving the way for a strong rally in the broader U.S. dollar. Today’s events also led traders to reprice the Fed’s terminal rate higher, raising the odds of a quarter-point hike at the December FOMC meeting to 36% from 26% a day ago. Naturally, both gold and silver reacted adversely to these developments, erasing earlier gains and slipping into negative territory.
Although prevailing market conditions will be challenging for precious metals, a glimmer of hope is beginning to emerge on the horizon. For instance, recent Fedspeak advocating patience and indicating that the U.S. central bank will proceed carefully suggest that policymakers are on the verge of ending their hiking campaign. With the tightening cycle winding down, both nominal and real rates will have limited upside going forward, creating a more favorable backdrop for non-yielding assets.
In summary, the fundamental outlook for gold and silver appears bearish in the short term. However, the tide may turn in their favor in the coming months, especially for the yellow metal. This could mean a strong advance for XAU/USD in the latter part of the year and heading into 2024. The chance of a more significant rally could increase should unforeseen macroeconomic hurdles appear, leading the Federal Reserve to pivot to a more dovish posture for fear of a hard landing.
Eager to gain insights into gold's future trajectory and the upcoming market drivers for volatility? Discover the answers in our complimentary Q4 trading forecast. Download it for free now!

GOLD PRICE TECHNICAL ANALYSIS
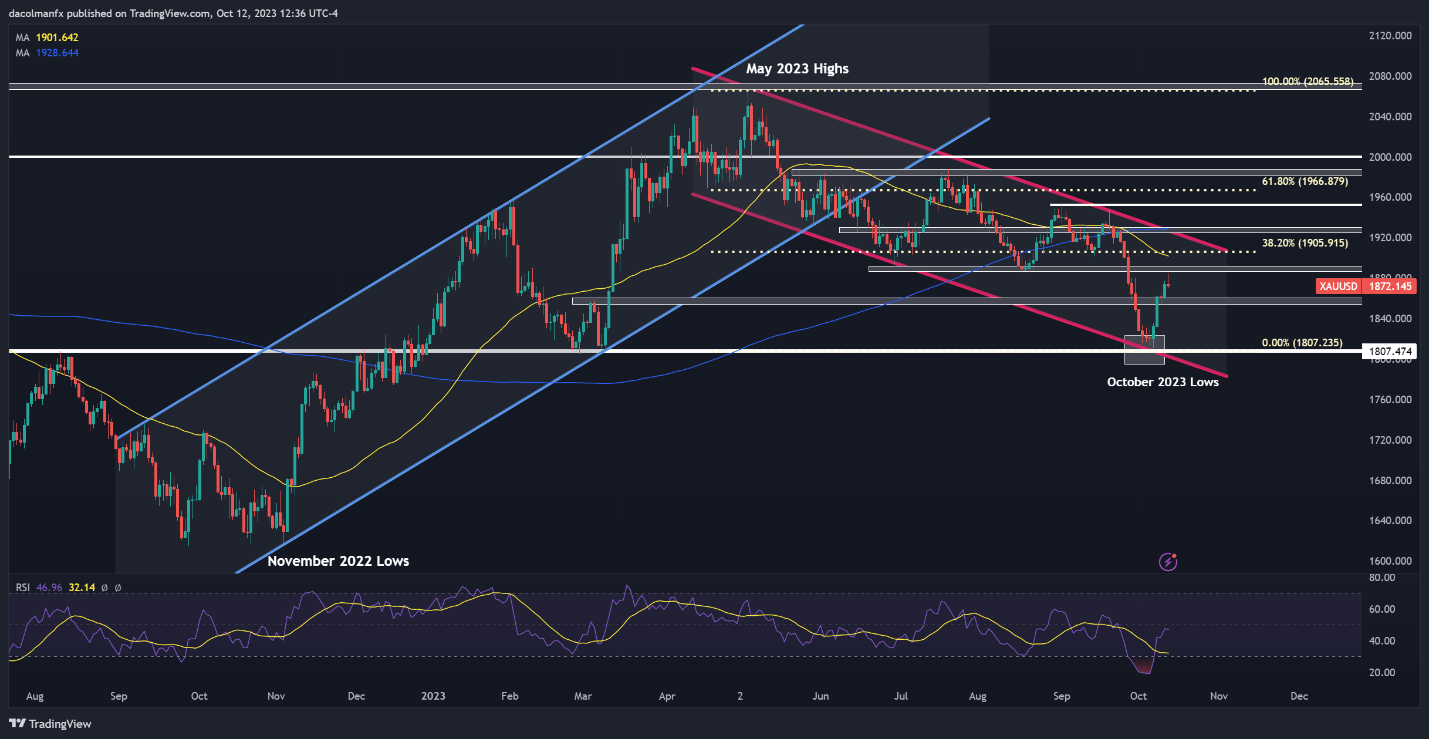
Gold made a move toward a technical resistance zone around $1,885 earlier on Thursday, only to face a swift rejection, signaling the enduring grip of sellers on the market. That said, traders should stay attentive to how price action unfolds in the upcoming days for indications of sustained weakness, as this scenario could take XAU/USD towards $1,860. While gold could find support in this area on a pullback, a breakdown could open the door to a retest of the 2023 lows.
Conversely, if buyers return and spark a strong rebound, initial resistance stretches from $1,885 to $1,890. The bears are likely to defend this ceiling tooth and nail, but in the event of an upside breakout, we could see a move towards $1,905, the 38.2% Fibonacci of the May/October decline. On further strength, the bulls could be emboldened and initiate an assault on channel resistance located in the vicinity of $1,925 at the time of writing.
Wondering how retail positioning can shape gold prices? Our sentiment guide provides the answers you seek—don't miss out, download it now!
| Change in | Longs | Shorts | OI |
| Daily | 5% | 8% | 6% |
| Weekly | 0% | -3% | -1% |
GOLD PRICE TECHNICAL CHART