Article by IG Senior Market Analyst Axel Rudolph
FTSE 100, S&P 500, Russell 2000 Analysis and Charts
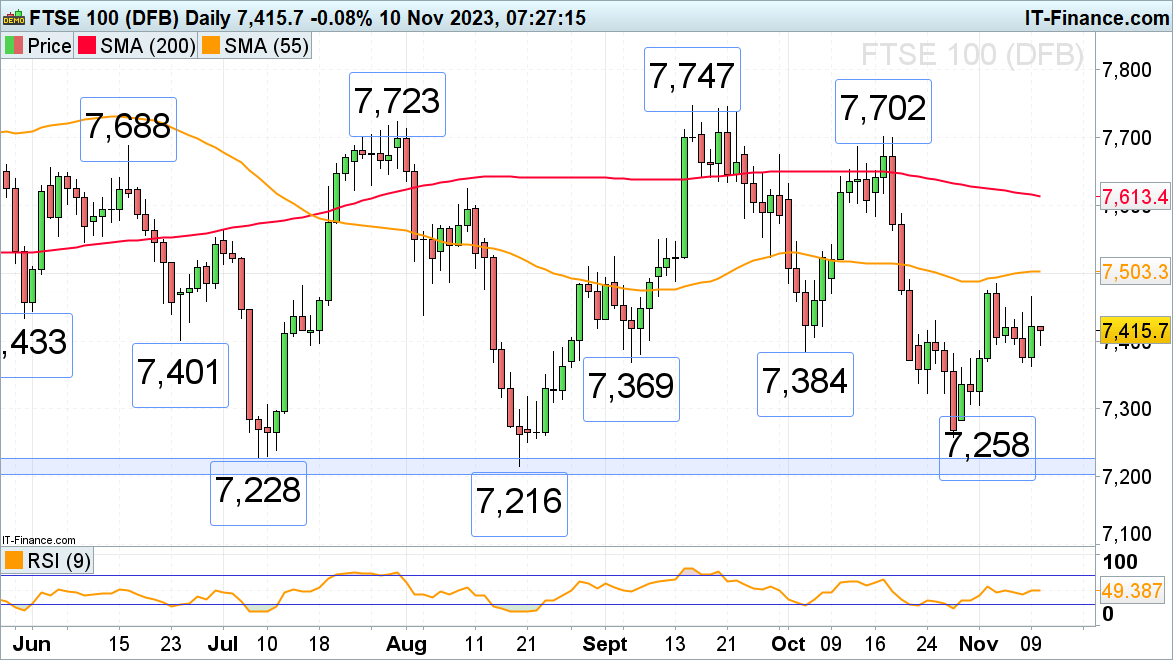
FTSE 100 recovery runs out of stream
The FTSE 100 has come off Thursday’s 7,466 high amid hawkish comments by the US Federal Reserve (Fed) Chair Jerome Powell and as the British economy stalls in the third quarter. So far the blue chip index remains above Thursday’s low at 7,363, though. As long as it does, overall upside momentum should remain in play. On a rise above this week’s high at 7,466 last week’s high at 7,484 and the 55-day simple moving average at 7,503 would be back in the picture. These levels would need to be overcome for the early September high at 7,524 to be back in focus.
Minor support can be seen between the early September and early October lows at 7,384 to 7,369 ahead of this week’s low at 7,363. Were it to be slipped through, though, a drop toward the October low at 7,258 may ensue. The 7,258 low was made close to the 7,228 to 7,204 March-to-August lows which represents significant support.
FTSE 100 Daily Chart
Download our Top Q4 Trade Ideas

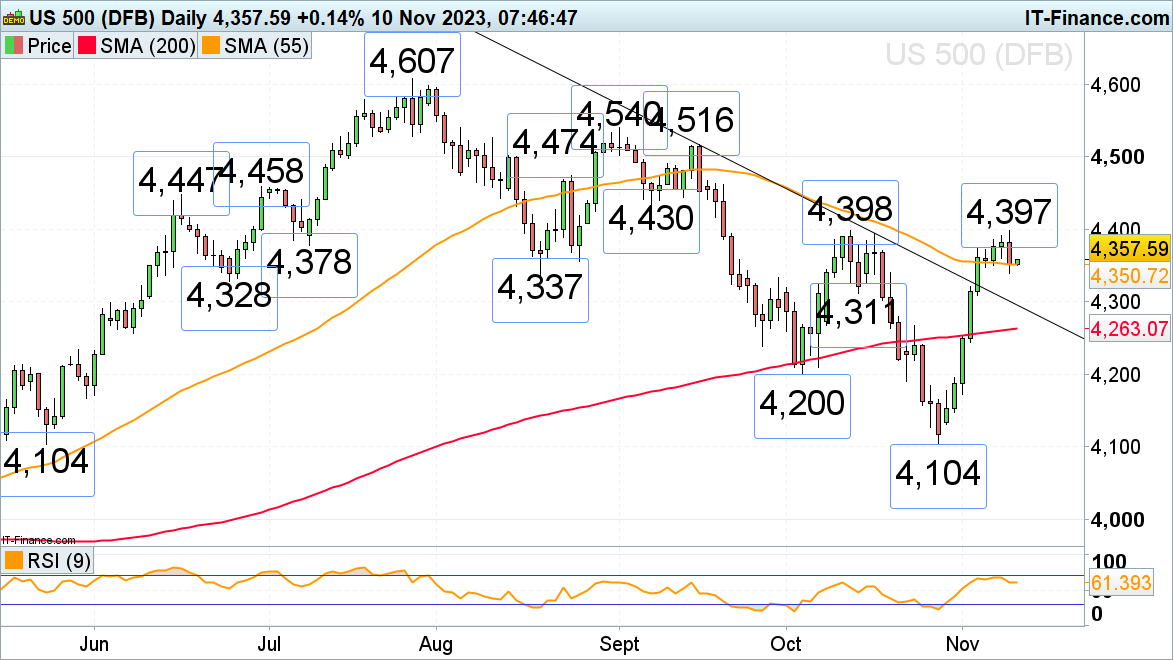
S&P 500 comes off mid-October high at 4,398
The sharp 6% rally in the S&P 500 finally ran out of steam near the 4,398 mid-October peak as Jerome Powell stated that it is too early to definitely announce the conclusion of the Fed’s interest rate hiking cycle and following a disappointing US 30-year bond auction which pushed bond yields higher and equities lower. The 55-day simple moving average (SMA) at 4,351 is currently being tested ahead of Thursday’s 4,339 low and the 4,337 August low. Were it to give way, the late June low at 4,328 may act as support. Further potential support comes in along the mid-October 4,311 low.
A rally above 4,398 would confirm a major medium-term bottoming formation and would put the 4,540 September peak back on the cards.
S&P 500 Daily Chart

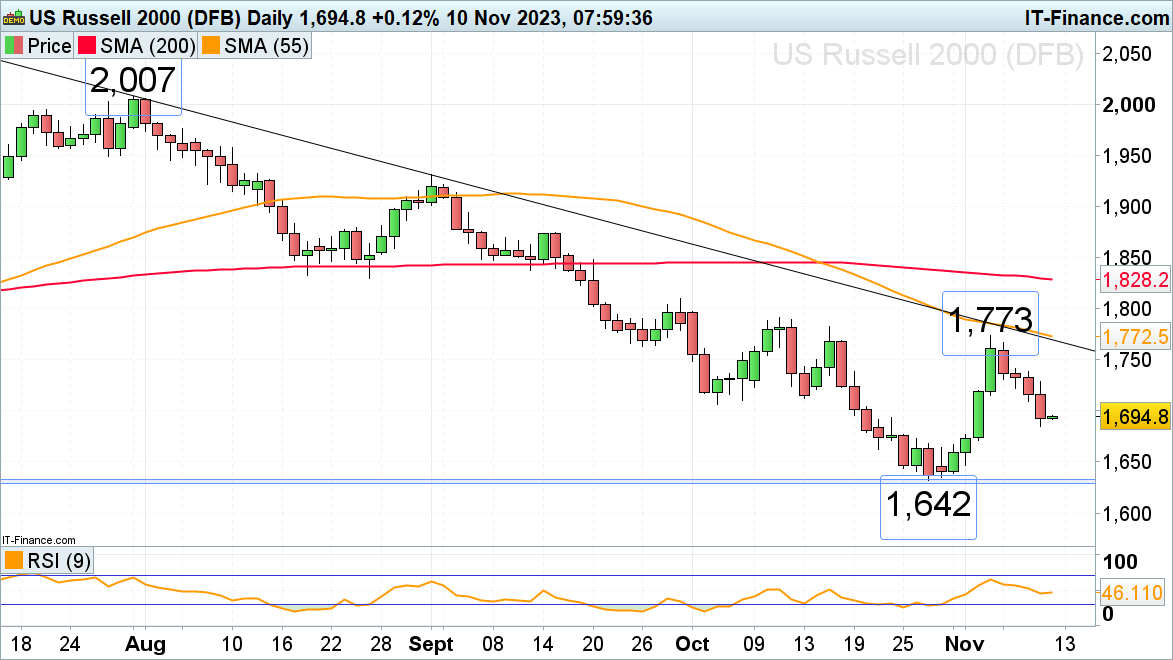
Russell 2000 gives back half of its recent gains
The Russell 2000, the great underperformer of US stock indices with a 3.5% negative performance year-to-date, is seen slipping back towards its one-year low at 1,642 whilst giving back half of last week’s gains to 1,773. The index is still expected to level out above its major 1,633 to 1,631 September and October 2022 lows as the US Fed is expected to near the end of its hiking cycle. It may do so ahead of or around minor support at the 23 October low at 1,663.
Minor resistance can be spotted at the 1,707 early October low and also at the 1,713 mid-October low, ahead of last week’s 1,773 high.
Russell 2000 Daily Chart