


Article by IG Chief Market Analyst Chris Beauchamp
FTSE 100, DAX 40, Dow Jones Analysis and Charts
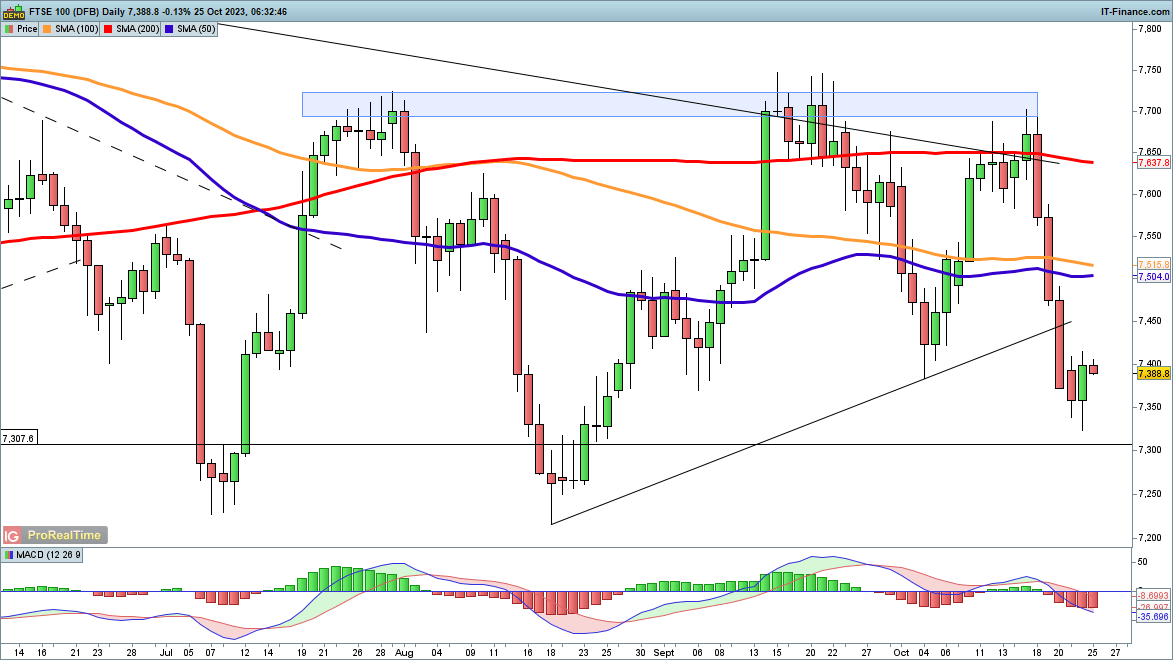
FTSE 100 testing 7400
The index managed to rebound on Tuesday, recovering some losses. For a low to be formed, we would need to see additional gains towards 7450, which might then bolster a near-term bullish view and open the way towards the 200-day SMA.
A close back below 7310 would negate this view.
FTSE 100 Daily Chart
See how Retail Customers are positioned in the FTSE 100
| Change in | Longs | Shorts | OI |
| Daily | 9% | -7% | -4% |
| Weekly | -10% | 9% | 5% |
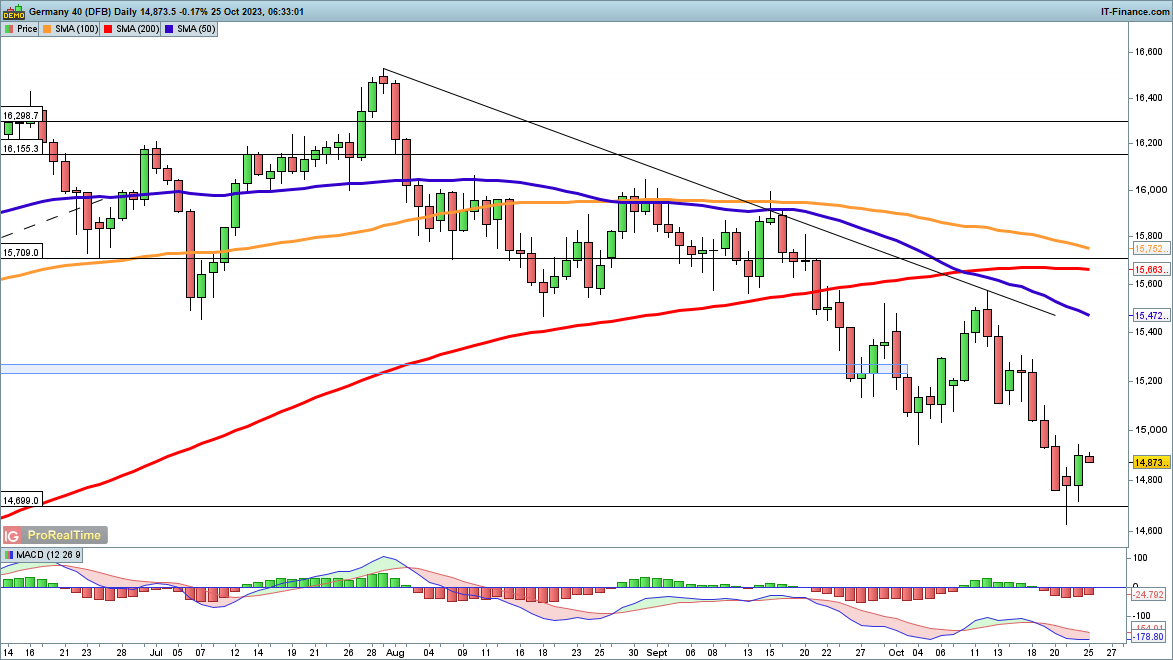
Dax rebounds from low
Tuesday saw the index make some headway, building on Monday’s dip below and then recovering above 14,700. While this has halted the selling for now, further gains back above 15,000 would be needed to suggest that a low is in. This might then allow the index to target trendline resistance from the August highs, as well as the 50-day SMA.
A close below 14,750 might cancel out this bullish view for the time being.
DAX40 Daily Chart

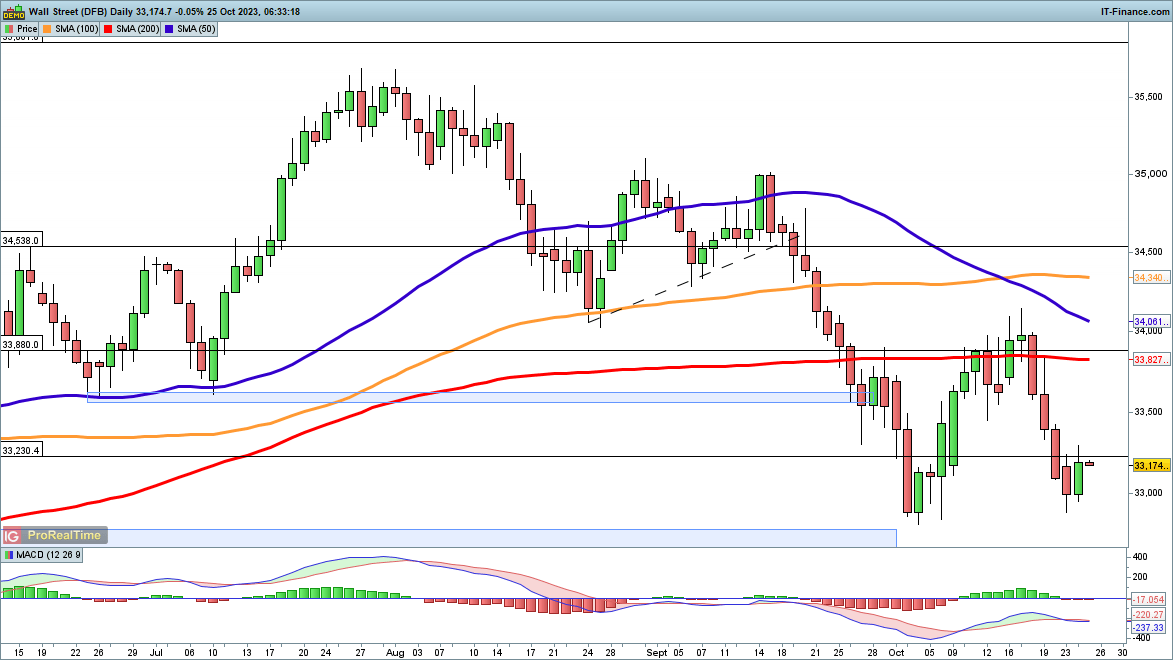
Dow makes headway
Like other indices, the Dow staged a recovery on Tuesday, but it is not yet certain that a low has been formed. Any continued recovery targets the 200-day SMA and then the October highs around 34,000. A close above 34,100 might signal that a broader rally was underway.
A close below the September lows would signal that the sellers have regained control.
Dow Jones Daily Chart
Download our free Q4 Equities Forecast


