Article by IG Senior Market Analyst Axel Rudolph
FTSE 100, DAX 40, S&P 500 Analysis and Charts
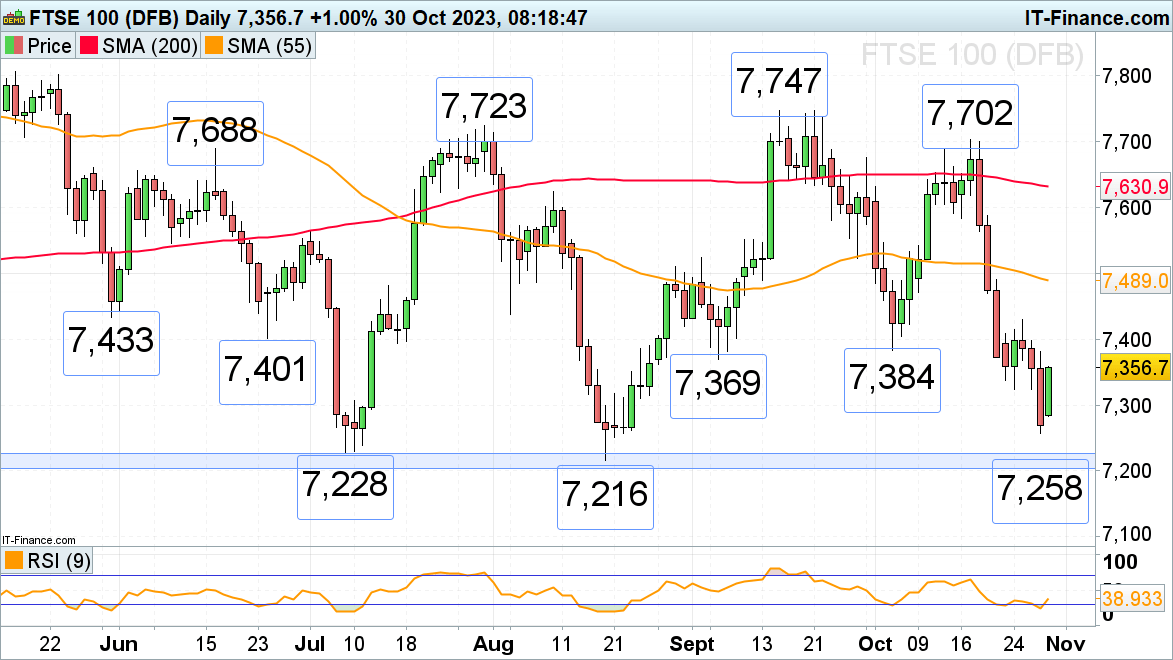
FTSE 100 tries to stabilize The FTSE 100 is trying to regain some of last week’s sharp losses which were due to risk-off sentiment surrounding the Middle East and the ‘rates higher for longer’ outlook.The decline took it to a two-month low at 7,258 with the early September and early October lows at 7,369 to 7,384 being back in sight for Monday’s recovery rally. This area might act as resistance, though. If not, Wednesday’s high at 7,430 could be back in the frame. If overcome on a daily chart closing basis, a medium-term bullish reversal in the seasonally favorable period until year-end could be in the making.
Major support below Friday’s 7,258 low can be spotted between the 7,228 to 7,204 March-to-August lows.
FTSE 100 Daily Chart
| Change in | Longs | Shorts | OI |
| Daily | 14% | -7% | -4% |
| Weekly | -6% | 9% | 6% |
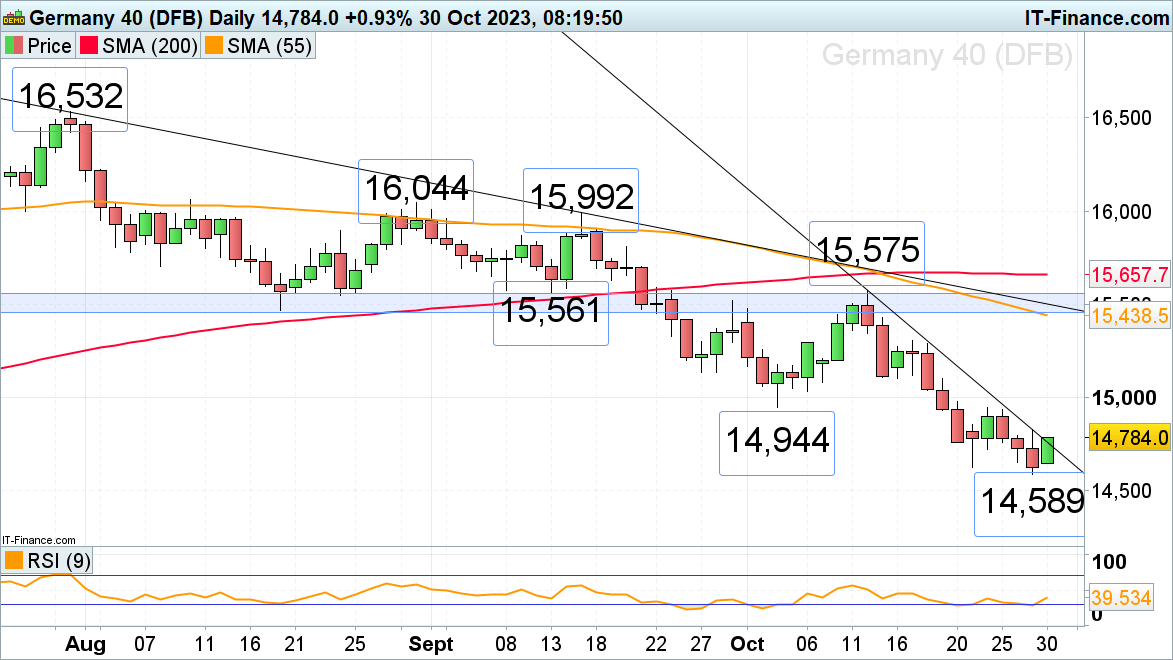
DAX 40 tries to bounce off its seven-month low
The DAX 40’s fall to 14,589 on Friday has been followed by a slightly more bullish sentiment on Monday morning with the index seen breaking through its October downtrend line at 14,756 as investors await key German preliminary Q3 GDP and inflation data and the Eurozone business climate report. A rise above Friday’s 14,825 high would put last week’s high at 14,945 back on the plate. If bettered on a daily chart closing basis, a medium-term bullish reversal may occur at the end of the year.
Potential slips through Friday’s 14,589 low would open the way for the March trough at 14,459, though.
DAX 40 Daily Chart
See our Q4 Equities Forecast

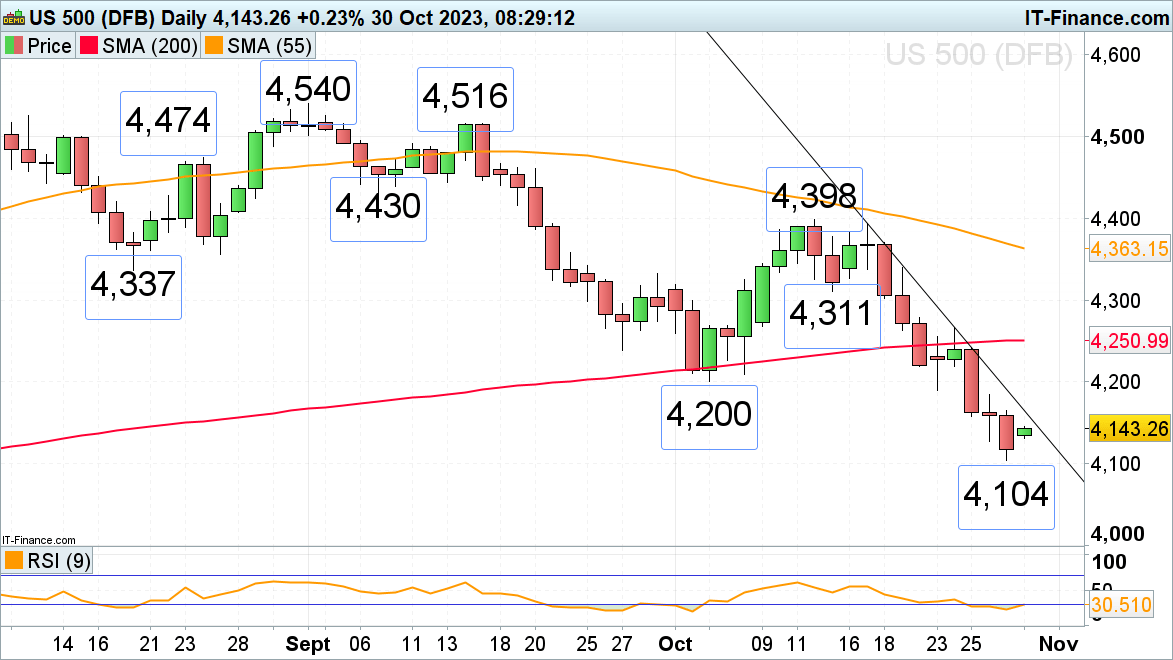
S&P 500 futures point to higher open after several dismal weeks
Last week the S&P 500 slipped to its 4,104 late May low as investors worried about an escalation in the Middle East. This week all eyes are on the US Federal Reserve’s Federal Open Market Committee (FOMC) meeting in the middle of the week and US employment data. The S&P 500 may rise to its accelerated downtrend line at 4,162 above which the early October low at 4,200 may also act as resistance. For any significant bullish reversal to gain traction not only the 200-day simple moving average (SMA) at 4,251 would need to be exceeded but also Tuesday’s high at 4,266, the last reaction high on the daily candlestick chart.
A fall through 4,104 could lead to the next lower May low at 4,047 being back in sight, however.
S&P 500 Daily Chart