Article by IG Senior Market Analyst Axel Rudolph
FTSE 100, DAX 40, S&P 500 Analysis and Charts
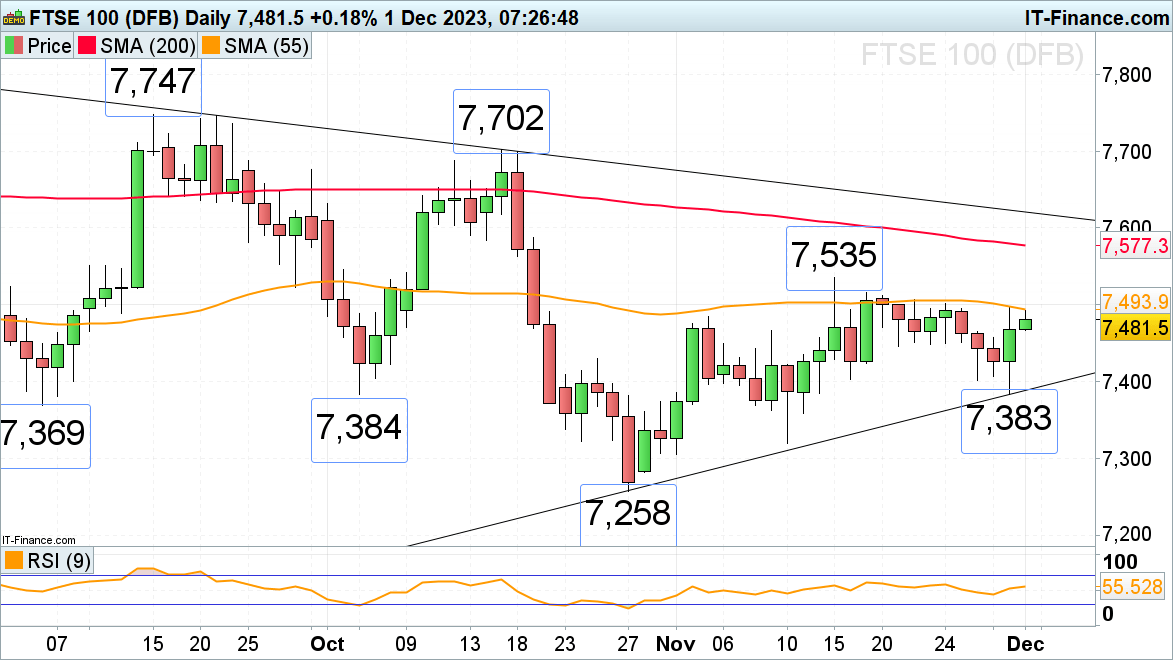
FTSE 100 ends the month in positive territory
The FTSE 100 slid to 7,383 on Thursday before reversing to the upside as inflation continues to weaken in the eurozone. The 55-day simple moving average (SMA) at 7,494 capped and is doing so once more on Friday morning. Once overcome, the 17 November high at 7,516 will be in focus, together with the 7,535 November high.
Minor support is found at the 21 November low at 7,446.
FTSE 100 Daily Chart
Download our Complimentary FTSE Sentiment Guide
| Change in | Longs | Shorts | OI |
| Daily | 9% | -7% | -4% |
| Weekly | -10% | 9% | 5% |
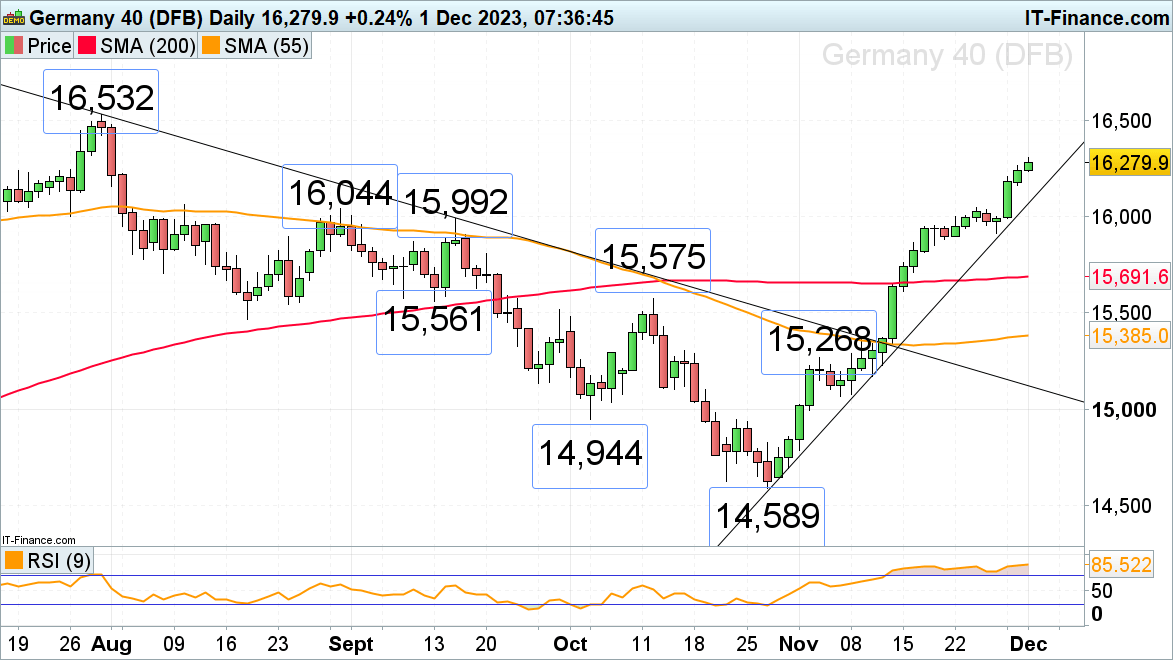
DAX 40 continues to surge ahead as eurozone inflation weakens
The DAX 40 continues to surge ahead as eurozone inflation came in weaker-than-expected on Thursday with the July peak at 16,532 being in sight. Minor resistance on the way up can be spotted at the 16,421 31 July low.
Support below Friday’s intraday low at 16,236 is seen at Thursday’s 16,165 low. More significant support can be found between the August and September highs at 16,044 to 15,992.
DAX 40 Daily Chart
See How Successful Traders Approach the Market

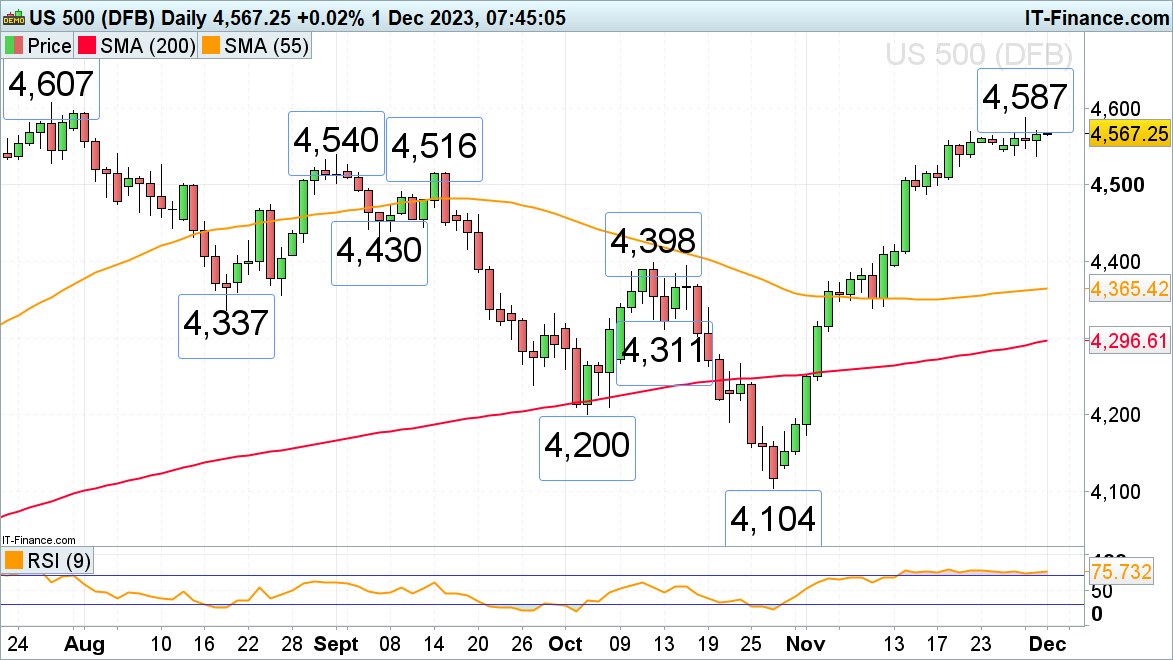
S&P 500 sees best November since 1980
The sharp November rally in the S&P 500 has lost upside momentum but the index nonetheless continues to trade in four-month highs as the Fed’s preferred PCE inflation gauge came in as expected at 3% year-on-year in October.November was not only the best-performing month for the S&P 500 this year but also the strongest November since 1980.
Resistance is found at the November peak at 4,587, followed by the July peak at 4,607. While this week’s lows at 4,539 to 4,537 underpin, the short-term uptrend remains intact. Slightly further down sits potential support at the 4,516 mid-September high.
S&P 500 Daily Chart