


Article by IG Senior Market Analyst Axel Rudolph
FTSE 100, DAX 40, S&P 500 Analysis and Charts
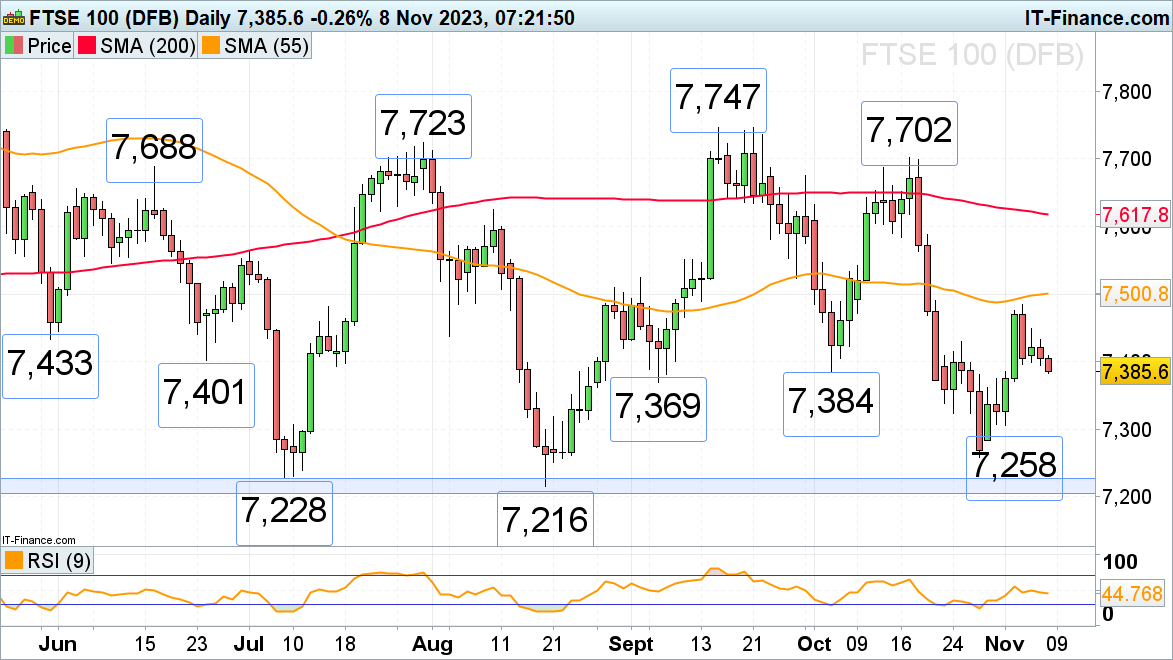
FTSE 100 weighs on minor support
The FTSE 100 continues to slide on some disappointing earnings. The index is in the process of testing the early September and early October lows at 7,384 to 7,369 and may drop towards the October low at 7,258 if these levels were to give way. The 7,258 low was made close to the 7,228 to 7,204 March-to-August lows which represents significant support.
Above Wednesday’s intraday high at 7,408 lies minor resistance at Tuesday’s 7,432 high and the 25 October high at 7,430.
Further up sits last week’s high at 7,484 which, together with the 55-day simple moving average at 7,501, would need to be overcome for the early September high at 7,524 to be back in the frame.
FTSE 100 Daily Chart
Download the Free FTSE 100 Sentiment Guide to see how Daily and Weekly Sentiment Changes Affect the Outlook
| Change in | Longs | Shorts | OI |
| Daily | 14% | -7% | -4% |
| Weekly | -6% | 9% | 6% |
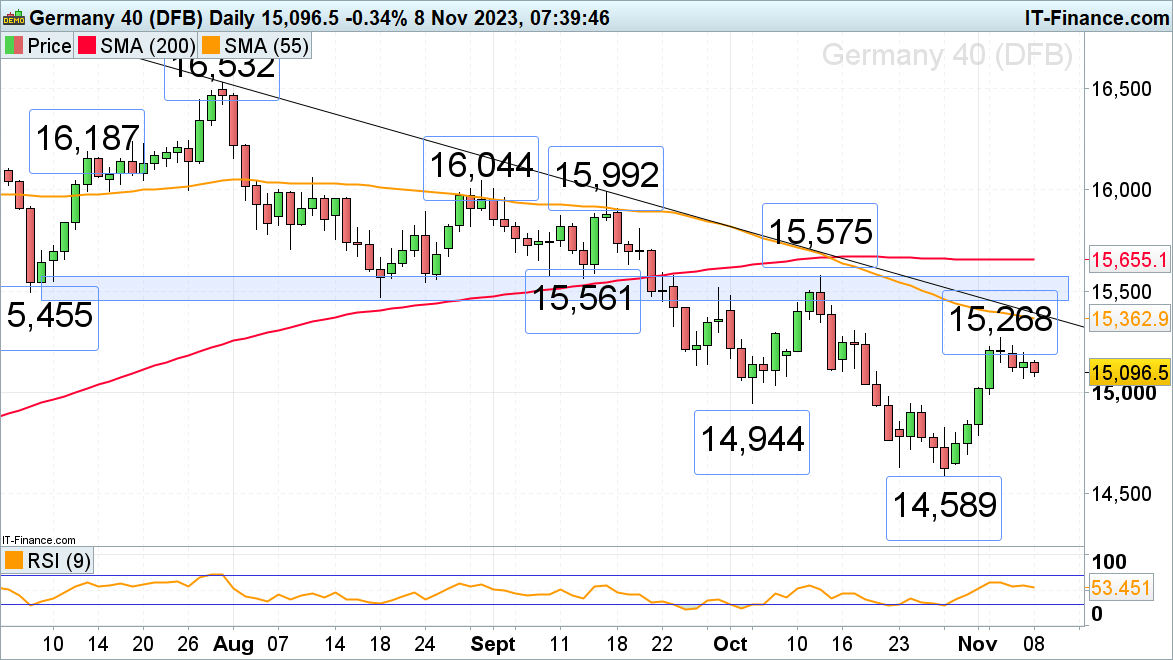
DAX 40 consolidation is ongoing
The DAX 40’s rally from its 14,589 October low took it to Friday’s 15,268 high before consolidating this week. In case of a fall through Tuesday’s low at 15,067, the minor psychological 15,000 mark and the early October low at 14,944 may be revisited.
For the bull run to continue, Tuesday’s high at 15,194 would need to be exceeded in which case last week’s high at 15,268 would be back in focus. Further up beckon the 55-day simple moving average (SMA) and the July-to-November downtrend line at 15,363 to 15,390. Slightly above this area sits major resistance between the 15,455 to 15,575 July-to-mid-September lows and the mid-October high.
DAX 40 Daily Chart

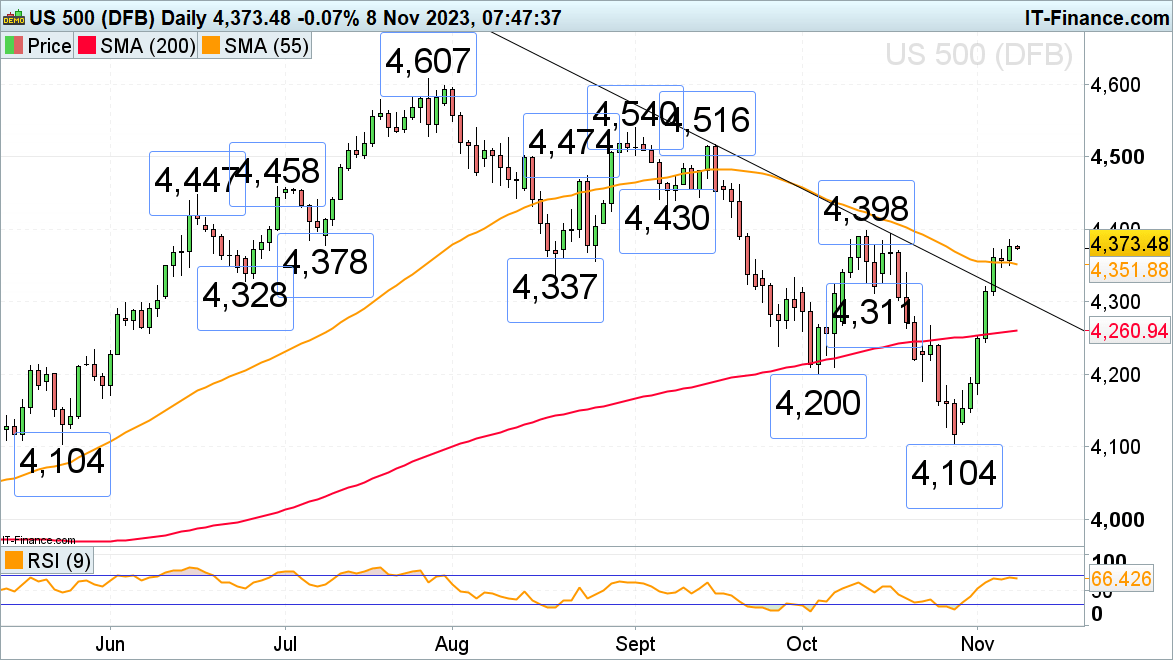
S&P 500 nears mid-October high at 4,398
The sharp rally in the S&P 500 is losing upside momentum amid high US treasury yields and hawkish comments by US Federal Reserve (Fed) members and as it approaches its mid-October high at 4,398 around which it may short-term consolidate. If not, the early September low at 4,430 would be eyed next.
Minor support can be seen along the 55-day simple moving average (SMA) at 4,352 and at Monday’s 4,348 low. Further minor support sits at the 4,337 August trough.
S&P 500 Daily Chart
See our Q4 Equities Forecast


