Article by IG Senior Market Analyst Axel Rudolph
FTSE 100, DAX 40, Nasdaq 100 Analysis and Charts
FTSE 100 rallies on softer US and UK inflation
A host of large-cap dividend payments on Thursday put the FTSE 100 on the back foot, together with disappointing results from Burberry’s with its share price dropping by over 10%.
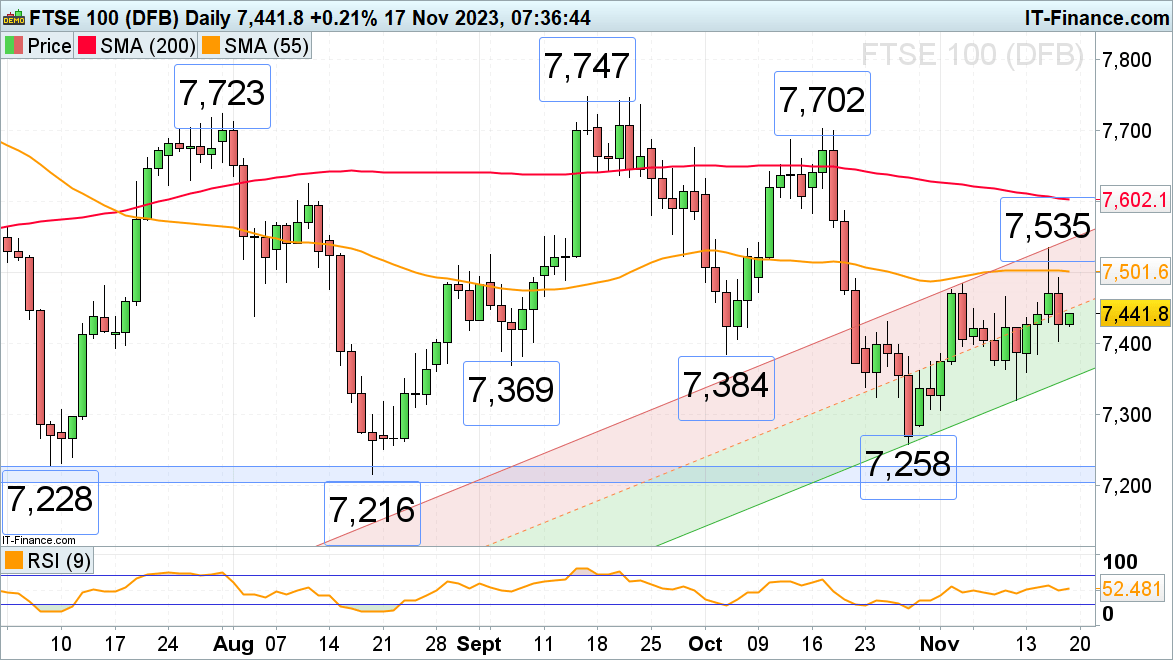
Early Friday morning UK retail sales slid to their lowest level since the 2021 COVID-19 lockdown, by 0.3% in October 2023, following a downwardly revised fall of 1.1% in September. This did not prevent the FTSE 100 from recovering from Thursday’s low at 7,403. While it holds, the 9 November high at 7,466 may be reached. Further up sits more significant resistance between the early November high and the 55-day simple moving average (SMA) at 7,484 to 7,501.
Support below Thursday’s 7,430 low can be found between the early September and early October lows at 7,384 to 7,369.
FTSE 100 Daily Chart
See How IG Client Sentiment Can Help You Make Better Informed Trading Decisions
| Change in | Longs | Shorts | OI |
| Daily | 14% | -7% | -4% |
| Weekly | -6% | 9% | 6% |
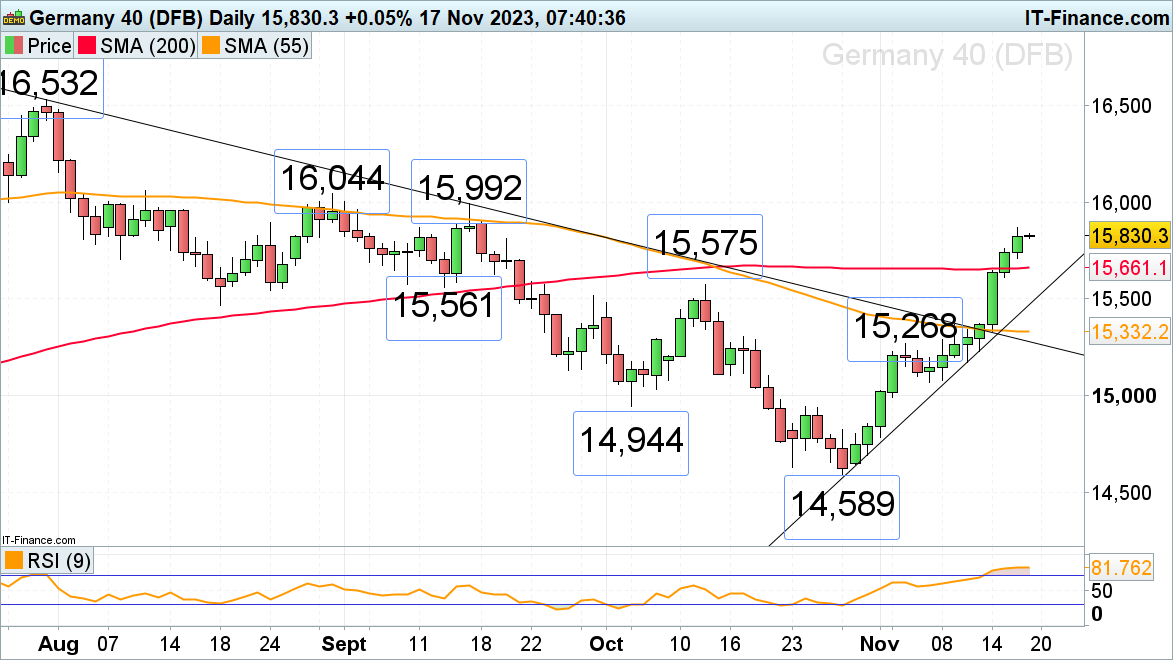
DAX 40 trades in two-month high
The DAX 40 continues to rise, having so far seen eight consecutive days of gains, and is approaching the August and September highs at 15,992 to 16,044 which may short-term cap.
Minor support below Thursday’s 15,710 low can be seen along the 200-day simple moving average at 15,661.Further down lie the early October high at 15,575 and the mid-September low at 15,561.
DAX 40 Daily Chart
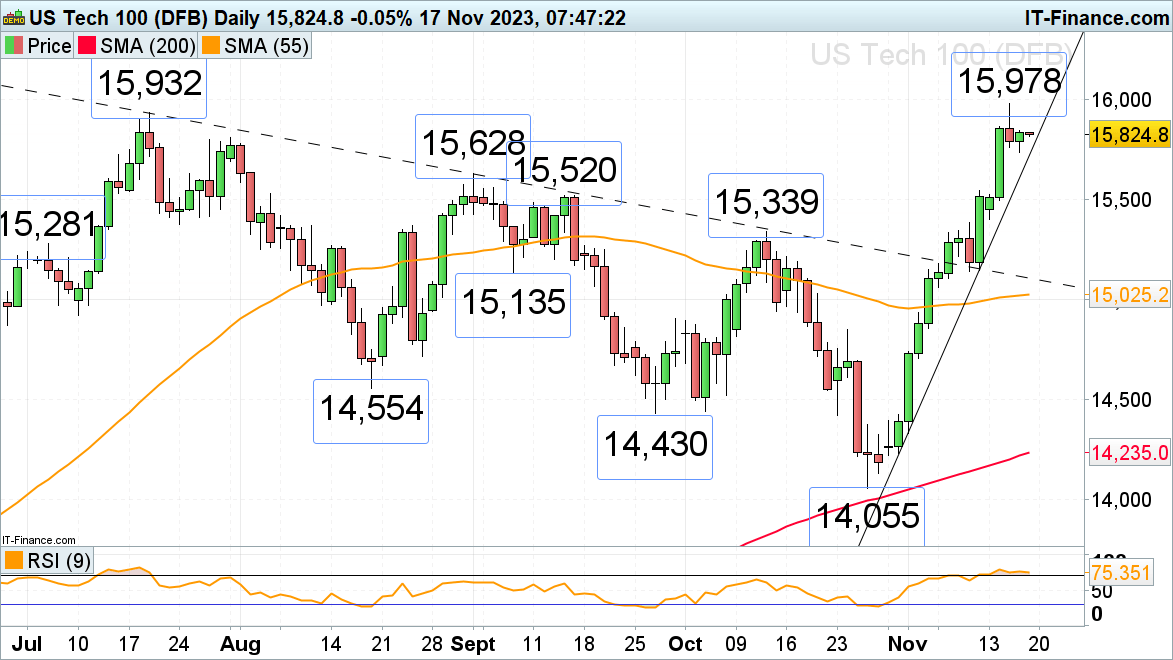
Nasdaq 100 flirts with the 15,932 July peak
The Nasdaq 100’s 12% rally off its late October low has taken the index to its July high which is short-term thwarting the advance ahead of the weekend amid profit taking and as the US’ largest retailer WalMart tumbles 8% amid a cautious outlook for consumer spending.
While the July and current November highs at 15,932 to 15,978 cap, Thursday’s low at 15,736, and the steep October-to-November uptrend line at 15,724 are likely to be revisited. Good support can be found between the 15,628 to 15,520 early to mid-September highs, though.
A rise above 15,978 would engage the December 2021 high at 16,660.
Nasdaq 100 Daily Chart