
GOLD OUTLOOK & ANALYSIS
- Will Fed Chair Jerome Powell change the narrative?
- Jackson Hole Symposium under the spotlight this week.
- Critical juncture for XAU/USD.

XAU/USD FUNDAMENTAL FORECAST
Gold prices are attempting a comeback after being suppressed for some time as the US dollar gained ascendency. With economic growth concerns in China mounting, the safe haven appeal aspect may increase with it.
Real yields (see below) have started to fall with expectations that Fed Chair Jerome Powell could potentially change the current narrative of ‘higher for longer interest rates to one of a more accommodative stance. If this is to occur, the Jackson Hole Economic Symposium (see economic calendar) will be the likely platform to do so and could provide some support for gold prices. With no other significant data releases between now and then, markets will likely remain relatively calm. The BRICS summit and the China LPR release earlier in the week could stoke some short-term volatility but all eyes will be on Jackson Hole.
Trade Smarter - Sign up for the DailyFX Newsletter
Receive timely and compelling market commentary from the DailyFX team
US 10-YEAR REAL YIELD
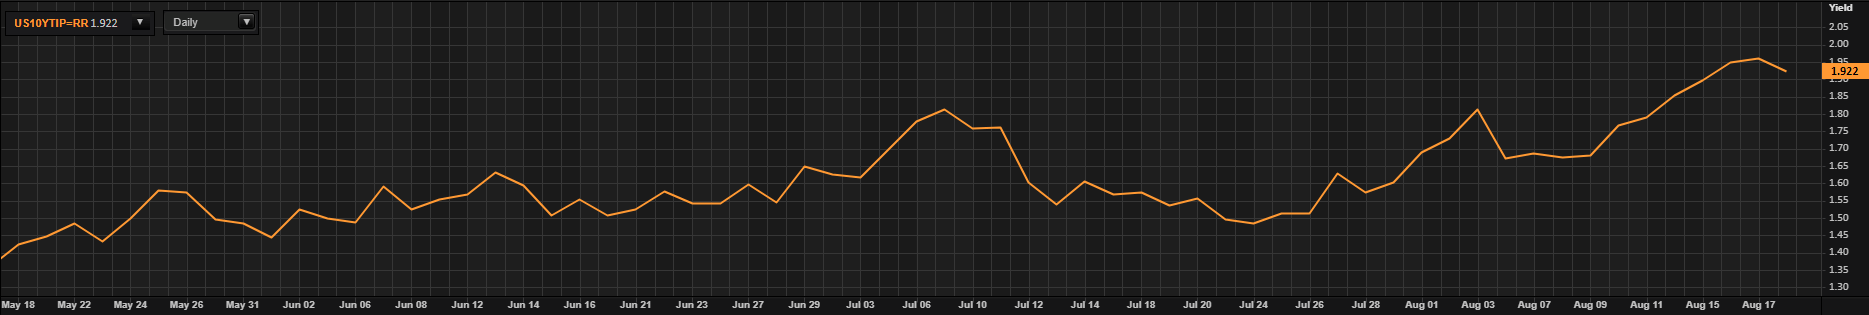
Source: Refinitiv
GOLD ECONOMIC CALENDAR
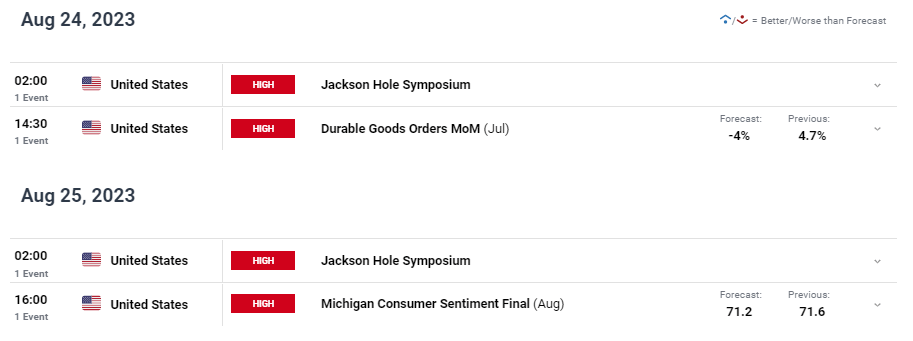
Source: DailyFX
Looking at money market pricing, the last few months has seen a drastic change in market expectations with estimates initially looking at rate cuts as early as September 2023 to the current May 2024 forecast. Any dovish guidance next week could bring this forward, possibly reducing real yields further and playing into the hands of gold bulls.
IMPLIED FED FUNDS FUTURES
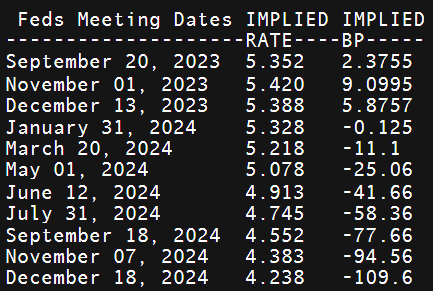
Source: Refinitiv
TECHNICAL ANALYSIS
Introduction to Technical Analysis
Candlestick Patterns
Recommended by Warren Venketas
GOLD PRICE DAILY CHART
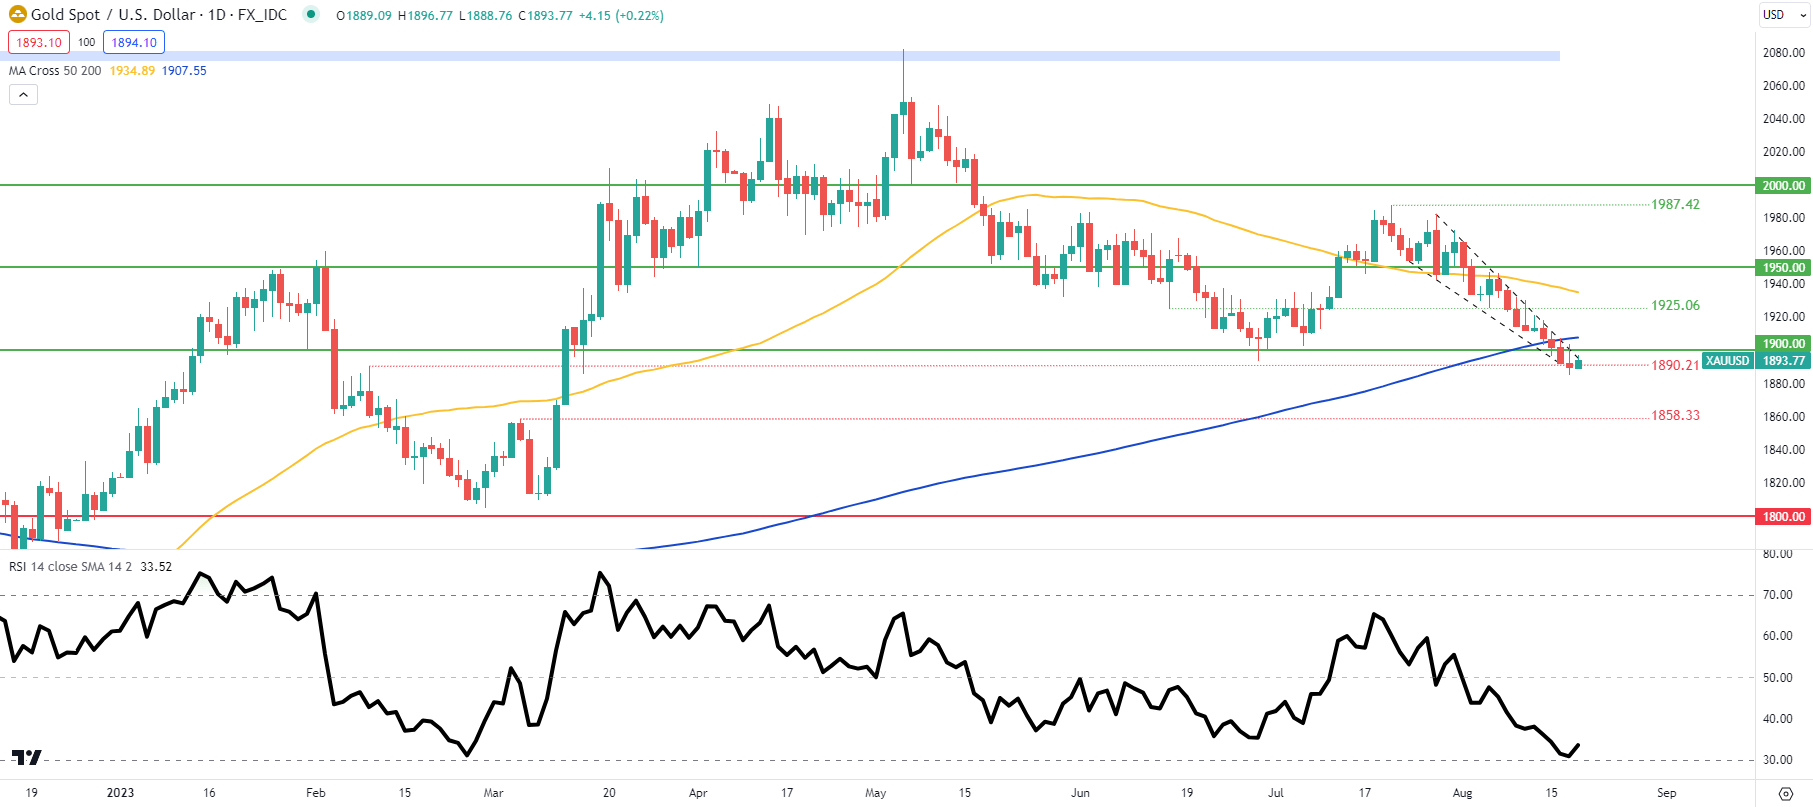
Chart prepared by Warren Venketas, IG
XAU/USD price action is nearing the apex of the falling wedge chart pattern (black) that has been developing for the last few weeks. As prices edge closer to the oversold region on the Relative Strength Index (RSI), there is still room for further downside. A confirmation close above wedge resistance and the 1900.00 psychological handle could spark an upside rally while a close below 1890.21 may fuel a larger selloff towards subsequent support zones.
Resistance levels:
- 200-day moving average (blue)
- 1900.00
- Wedge resistance
Support levels:
- 1890.21
- 1858.33
IG CLIENT SENTIMENT: MIXED
IGCS shows retail traders are currently distinctly LONG on gold, with 78% of traders currently holding long positions (as of this writing). Download the latest sentiment guide (below) to see how daily and weekly positional changes affect GOLD sentiment and outlook.
Introduction to Technical Analysis
Market Sentiment
Recommended by Warren Venketas
Contact and followWarrenon Twitter:@WVenketas