GOLD OUTLOOK & ANALYSIS
- Falling real yields make gold more attractive to investors.
- US economy in focus later today.
- Bearish/negative divergence on daily gold chart could bring bears back into the picture.
Elevate your trading skills and gain a competitive edge. Get your hands on the GOLD Q4 outlook today for exclusive insights into key market catalysts that should be on every trader's radar.

XAU/USD FUNDAMENTAL BACKDROP
Gold prices have been strengthening largely on the back of the bearish narrative associated with the US dollar in 2024. Markets have been swiftly ticking higher but may be slightly impatient. Although the implied Fed funds futures (see table below) suggests roughly 85bps of cumulative interest rate cuts by December 2024, the Fed along with other central banks have been rather cautious in their language and highly data dependent which could easily sway forecasts should economic data oppose the current trend.
IMPLIED FED FUNDS FUTURES
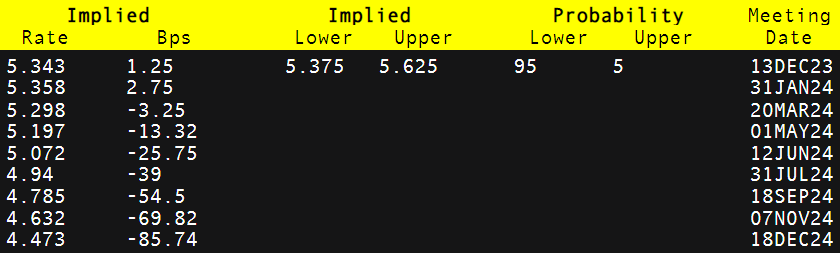
Source: Refinitiv
Falling US Treasury yields have been a key contributor (corresponding with lower real yields) to golds bullish move and after yesterday’s underwhelming US bond auction that sees the 2-year extending its downside while the 10-year Treasury yield stays depressed.
US REAL YIELDS (10-YEAR)
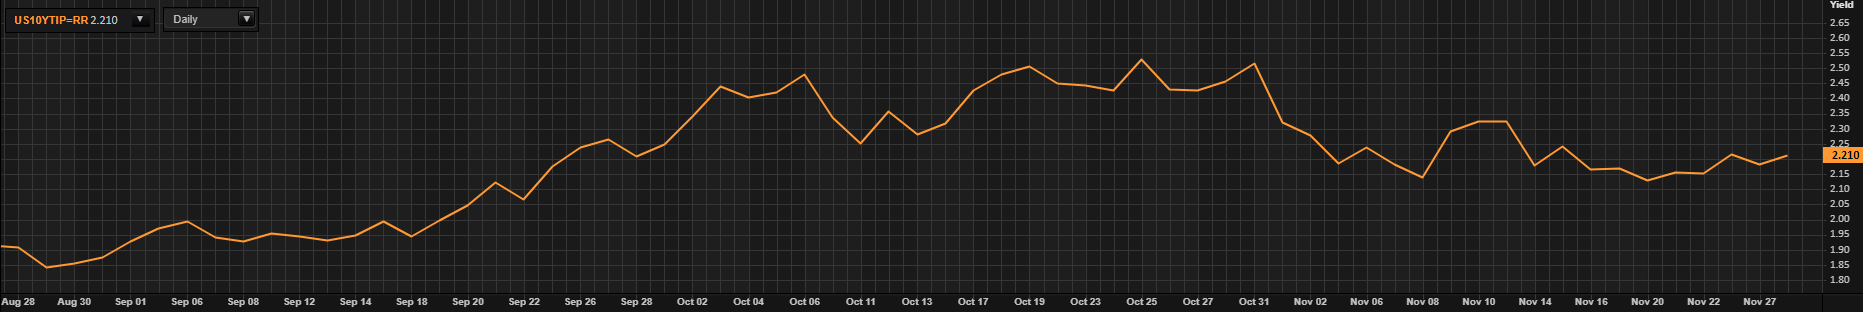
Source: Refinitiv
The economic calendar today has CB consumer confidence and Fed officials scheduled throughout the US trading sessions (see economic calendar below). From a safe haven perspective, the war between Israel and Hamas has now entered its 5th day of an agreed upon truce that could limit bullion’s appeal. Finally, China and Indian gold prices have reached close to local highs and may dampen demand from these two major consumers of gold.
GOLD ECONOMIC CALENDAR
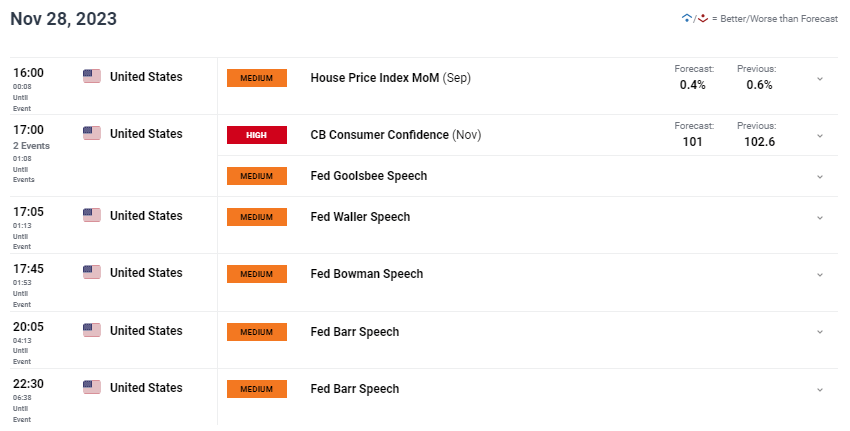
Source: DailyFX
Want to stay updated with the most relevant trading information? Sign up for our bi-weekly newsletter and keep abreast of the latest market moving events!
Trade Smarter - Sign up for the DailyFX Newsletter
Receive timely and compelling market commentary from the DailyFX team
TECHNICAL ANALYSIS
GOLD PRICE DAILY CHART
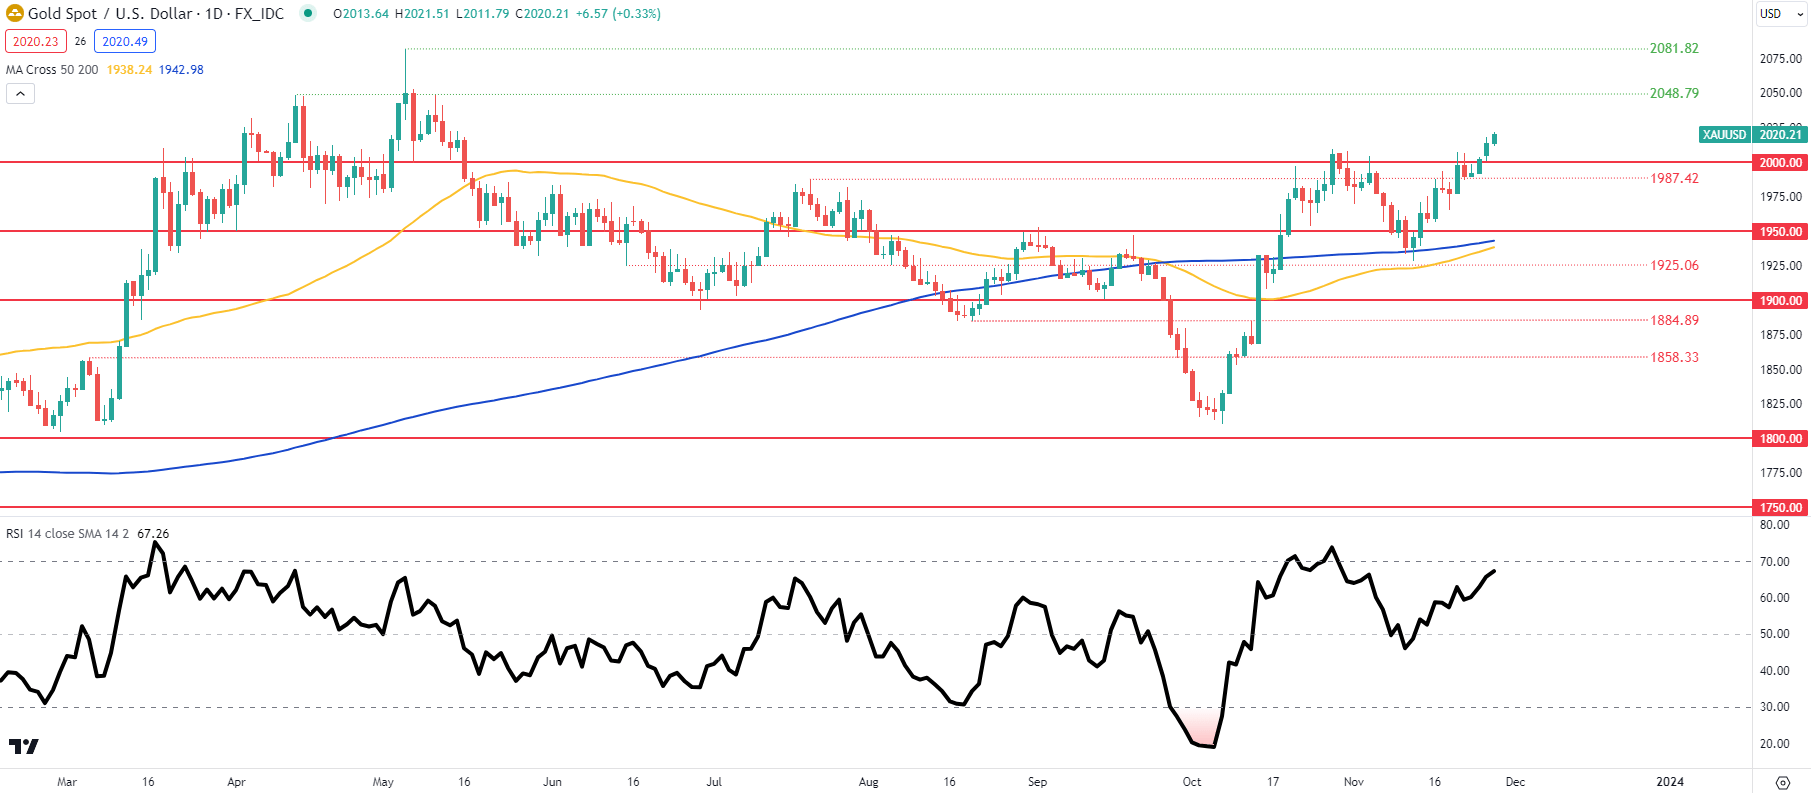
Chart prepared by Warren Venketas, TradingView
Daily XAU/USD price action stays firm above the $2000.00 support psychological handle but the Relative Strength Index (RSI) emits a worrying sign for bulls as the lower highs could indicate bearish/negative divergence to come short-term. Gold bulls may be excited at the prospect of a converging 50 and 200-day moving average that could unravel into a golden cross formation.
Resistance levels:
- 2081.82
- 2048.79
Support levels:
- 2000.00
- 1987.42
- 1950.00
GOLD IG CLIENT SENTIMENT: BULLISH
Curious to learn how market positioning can affect asset prices? Our sentiment guide holds the insights—download it now!
Introduction to Technical Analysis
Market Sentiment
Recommended by Warren Venketas
Contact and followWarrenon Twitter:@WVenketas