
US DOLLAR FORECAST – EUR/USD, USD/JPY, GBP/USD
- The U.S. dollar sinks to its lowest level since July, with the DXY index closing the week at 101.70
- No major events are expected in the week ahead, but that does not mean that volatility will be low, as thin liquidity conditions could amplify market moves
- This article zooms in on the technical outlook for EUR/USD, USD/JPY, and GBP/USD, analyzing essential price thresholds to monitor in the final trading sessions of 2023
Trade Smarter - Sign up for the DailyFX Newsletter
Receive timely and compelling market commentary from the DailyFX team
Most Read: US Dollar in Freefall Heading into 2024. What Now for EUR/USD, GBP/USD, Gold?
The U.S. dollar, as measured by the DXY index, dropped for the second consecutive week, closing at its lowest level since late July (101.70) in a low-volume environment ahead of the Christmas festivities and the final trading days of 2023.
Taking recent losses into account, the DXY index has fallen by about 4.21% in the fourth quarter and by roughly 1.75% in December, pressured by the significant pullback in government bond yields, which have corrected sharply lower from their cycle’s highs established in late October.
The Fed’s pivot has reinforced ongoing market trends, exacerbating the downward shift in the Treasury curve and the greenback’s retreat. To elaborate, the FOMC adopted a dovish position at its last meeting, admitting that it had begun talks of rate cuts and signaling 75 basis points of easing in 2024.
The following chart shows the magnitude of the shift in the Treasury curve over the last two months or so.
US TREASURY CURVE DOWNWARD SHIFT
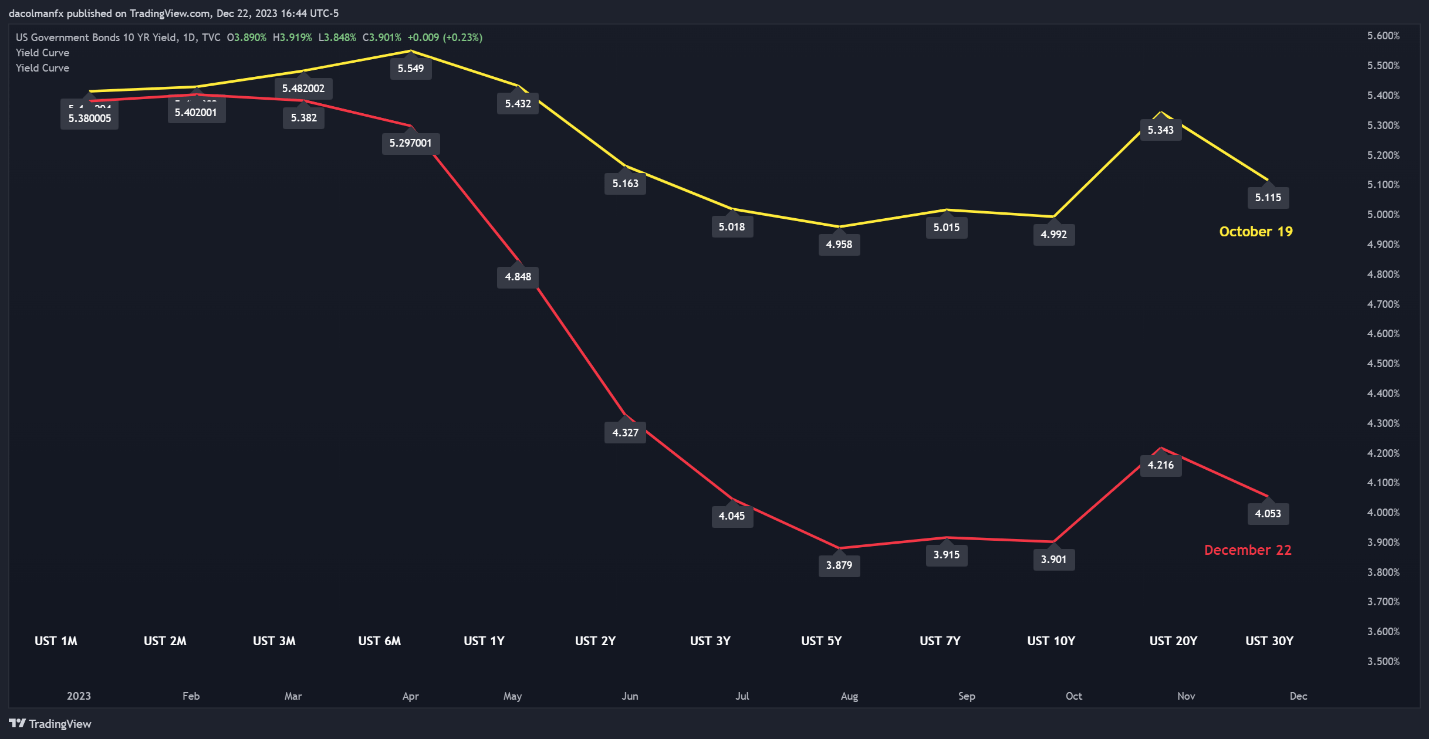
Source: TradingView
Looking ahead to the last week of 2023, there are no impactful releases on the calendar that might substantially alter current trends. This could result in the consolidation of recent moves, namely the weakening of the U.S. dollar and falling yields. Nevertheless, the absence of high-impact events on the calendar doesn’t guarantee low volatility and steady markets.
Reduced liquidity conditions, characteristic of the holiday period, can sometimes amplify price swings, as seemingly routine or moderate-sized trades can upset the delicate balance between supply and demand, with few traders on their desks to absorb buy and sell orders. Therefore, caution is strongly advised.
Refine your trading skills and stay one step ahead. Obtain the EUR/USD forecast for a comprehensive breakdown of the pair’s fundamental and technical outlook!

EUR/USD TECHNICAL ANALYSIS
Following recent gains, the EUR/USD now confronts a pivotal resistance zone between 1.1000 and 1.1025. If this ceiling is taken out decisively in the coming days, we could see a rally towards 1.1085. On further strength, the focus shifts to 1.1140, which corresponds to the upper limit of a rising channel in play since September.
On the flip side, if buyers’ efforts to drive prices higher fail and ultimately result in a downturn off current levels, initial support becomes visible at 1.0830, near the 200-day simple moving average. The pair is likely to bottom out in this area before resuming its advance, but in the event of a breakdown, a slump towards 1.0770 could be in the cards.
EUR/USD TECHNICAL CHART
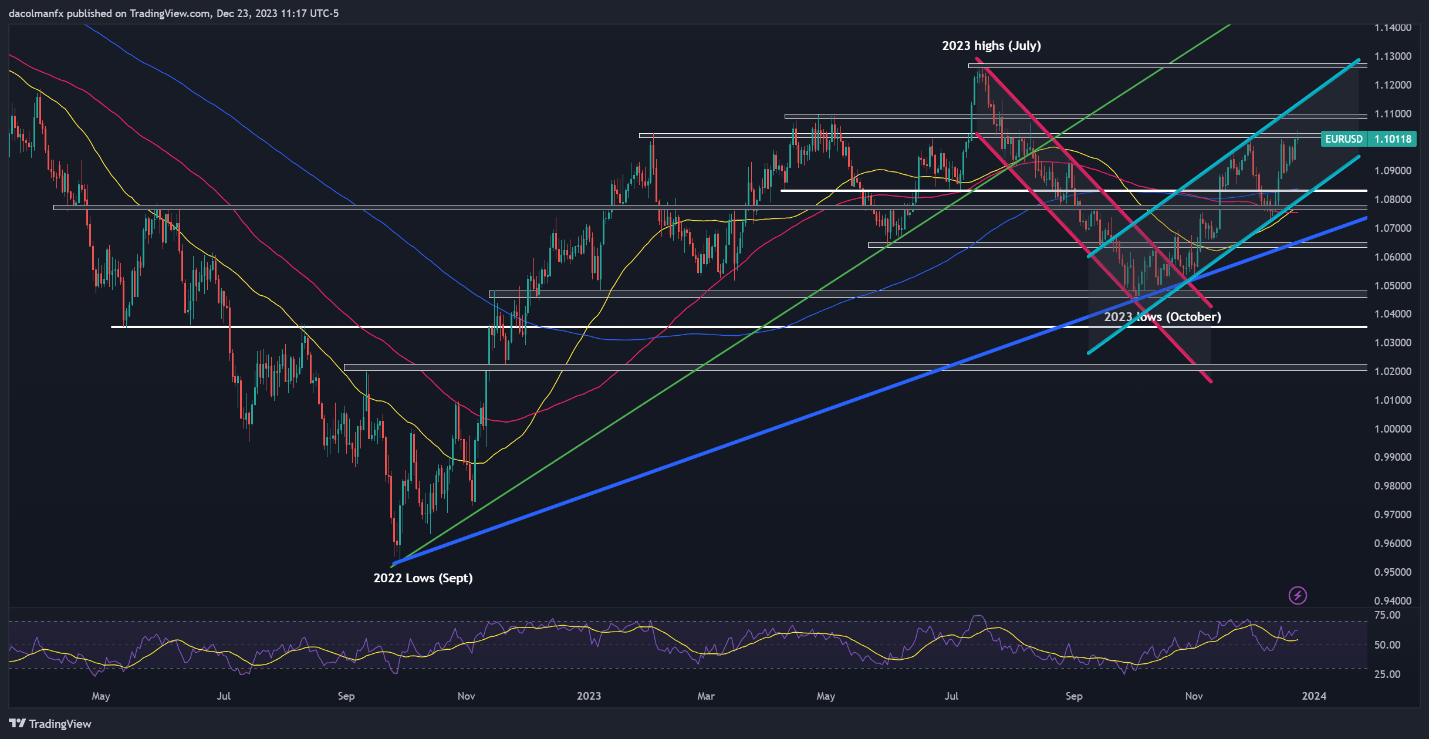
EUR/USD Chart Created Using TradingView
Access exclusive insights and strategies for USD/JPY by downloading the Japanese yen trading guide!

USD/JPY TECHNICAL ANALYSIS
USD/JPY ticked up on Friday but failed to reclaim its 200-day simple moving average. If the pair remains below this indicator in the coming days, selling pressure could start building momentum, setting the stage for an eventual decline towards the December lows at 140.95. This floor must be protected at all costs; failure to do so could spark a retracement towards trendline support at 139.50.
Conversely, if buyers regain the upper hand and propel USD/JPY above its 200-day SMA, resistance appears at 144.80. Surmounting this obstacle will prove challenging for the bullish camp, but a successful breakout could create the right conditions for an ascent toward the 146.00 handle. A continued display of strength could embolden the bulls to aim for 147.20.
USD/JPY TECHNICAL CHART
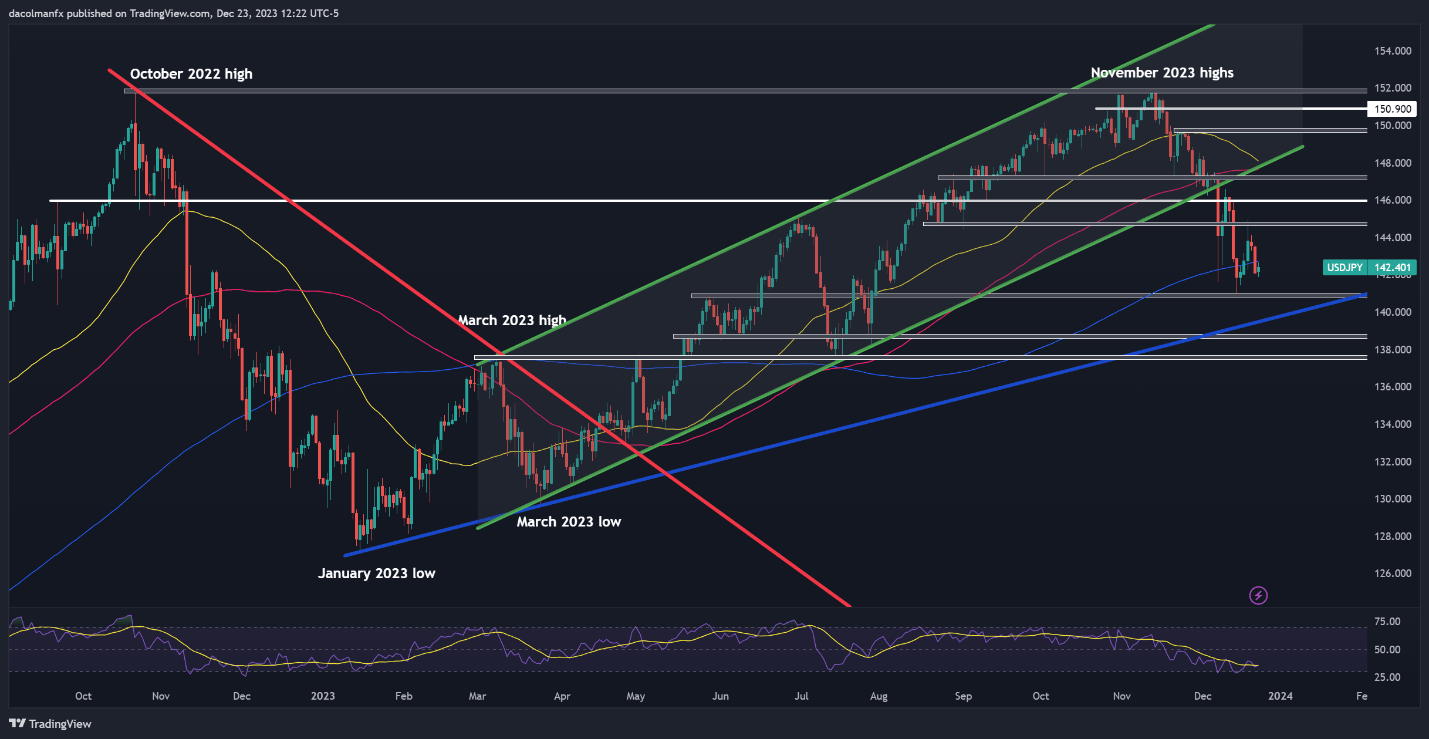
USD/JPY Chart Created Using TradingView
Want to understand how retail positioning can impact GBP/USD’s journey in the near term? Request our sentiment guide to discover the effect of crowd behavior on FX market trends!
| Change in | Longs | Shorts | OI |
| Daily | -9% | 3% | -4% |
| Weekly | -8% | 5% | -2% |
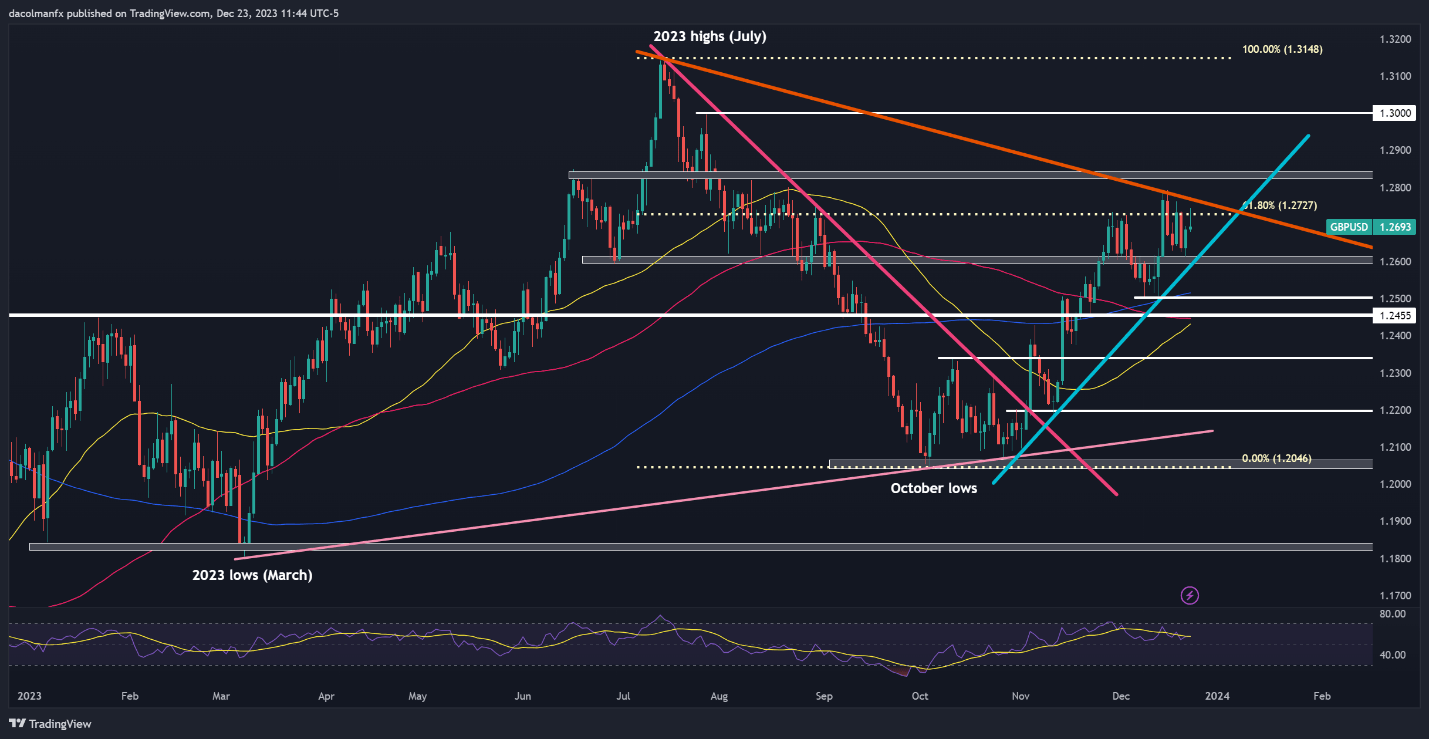
GBP/USD TECHNICAL ANALYSIS
GBP/USD inched up heading into the weekend but hit a roadblock at cluster resistance stretching from 1.2727 to1.2769, where a crucial Fibonacci level converges with a downtrend line extended from the 2023 peak. Reinforcing bullish momentum requires clearing this technical hurdle; with a successful breakout likely paving the way for a move towards 1.2800, followed by 1.3000.
On the other hand, if sellers stage a comeback and initiate a bearish reversal, trendline support is located around the 1.2600 area. This dynamic floor may offer stability during a pullback, but a push below it could usher in a retest of the 200-day simple moving average hovering slightly above the 1.2500 handle. Further weakness could redirect attention to 1.2455.
GBP/USD TECHNICAL CHART