
US DOLLAR OUTLOOK– EUR/USD, GBP/USD, GOLD PRICES
- The U.S. dollar, as measured by the DXY index, falls to its weakest point in nearly five months
- With U.S. bond yields on a downward trajectory and market exuberance on full display on Wall Street, further losses could be in stored for the greenback heading into the last week of 2023
- This article examines the technical profile for EUR/USD, GBP/USD and gold, analyzing major price thresholds that could be relevant for the retail crowd
Trade Smarter - Sign up for the DailyFX Newsletter
Receive timely and compelling market commentary from the DailyFX team
Most Read: US Dollar Sinks, Holds on For Dear Life, Setups on Gold, EUR/USD, GBP/USD
The U.S. dollar, as measured by the DXY index, softened on Friday, hitting its weakest level in nearly five months at one point during the regular U.S. trading session, following encouraging data on consumer prices. For context, November core PCE, the Fed’s favorite inflation gauge, clocked in at 0.1% m-o-m, bringing the annual rate to 3.2% from 3.4%, one-tenth of a percent below consensus estimates - a sign that the trend continues to move in the right direction.
US ECONOMIC DATA
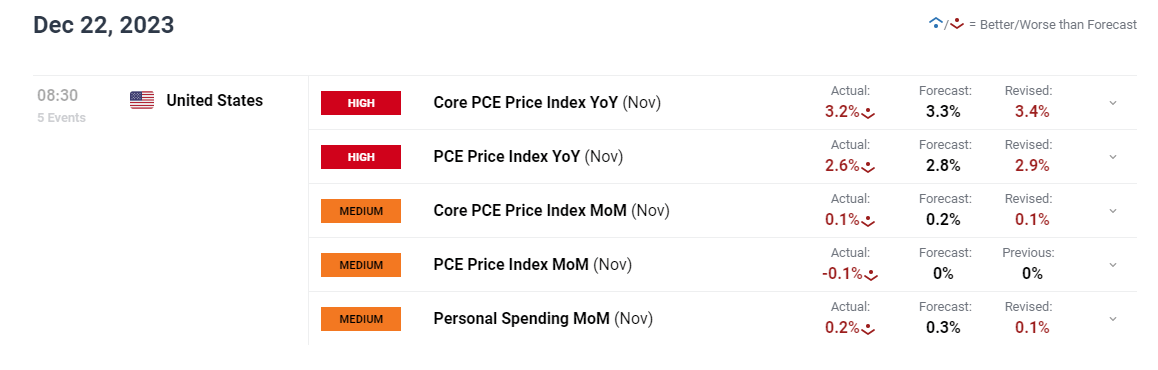
Source: DailyFX Economic Calendar
Factoring in the latest losses, the DXY index has fallen 4.1% in the fourth quarter and 1.8% in December, driven by the slump in government bond yields from the cycle’s highs.
Focusing on more recent price action, the Fed’s pivot last week has been the main source of U.S. dollar weakness over the past few days. Although the FOMC maintained the status quo at its last monetary policy meeting of the year, it admitted that it has begun to discuss rate cuts and signaled that it would slash borrowing costs several times by 2024.
The U.S. central bank’s dovish stance, which caught many investors off guard, has sparked a major downward correction in Treasury rates across the curve, pushing the 2-year note below 4.35% at some point this week - a notable retreat from its peak of 5.25% less than two months ago. The 10-year yield has also plummeted, trading beneath 3.9% on Friday after almost topping 5% in late October.
With U.S. yields skewed to the downside and market exuberance on full display on Wall Street, the U.S. dollar could deepen its near-term retracement. This could result in further upward momentum for gold, EUR/USD, and GBP/USD leading up to 2024, yet caution is warranted, with certain markets approaching potential overbought levels.
How long will the U.S. dollar’s downward correction last? Get all the answers in our quarterly outlook!

EUR/USD TECHNICAL ANALYSIS
After recent gains, EUR/USD has arrived at the doorsteps of an important resistance that stretches from 1.1000 to 1.1025. If buyers can break through this ceiling in the near term, there's potential for an upward thrust toward 1.1085. Further strength might shift attention to 1.1140, which represents the upper boundary of an ascending channel in play since September.
On the other hand, if the pair gets rejected from technical resistance and reverses to the downside, primary support appears near 1.0830, around the 200-day simple moving average. This area might provide stability during a pullback before a turnaround, but a decisive drop below it could be ominous, potentially exposing channel support at 1.0770.
Stay ahead of the curve and improve your trading prowess! Request the EUR/USD forecast for a comprehensive analysis of the pair’s underlying bias

EUR/USD TECHNICAL CHART
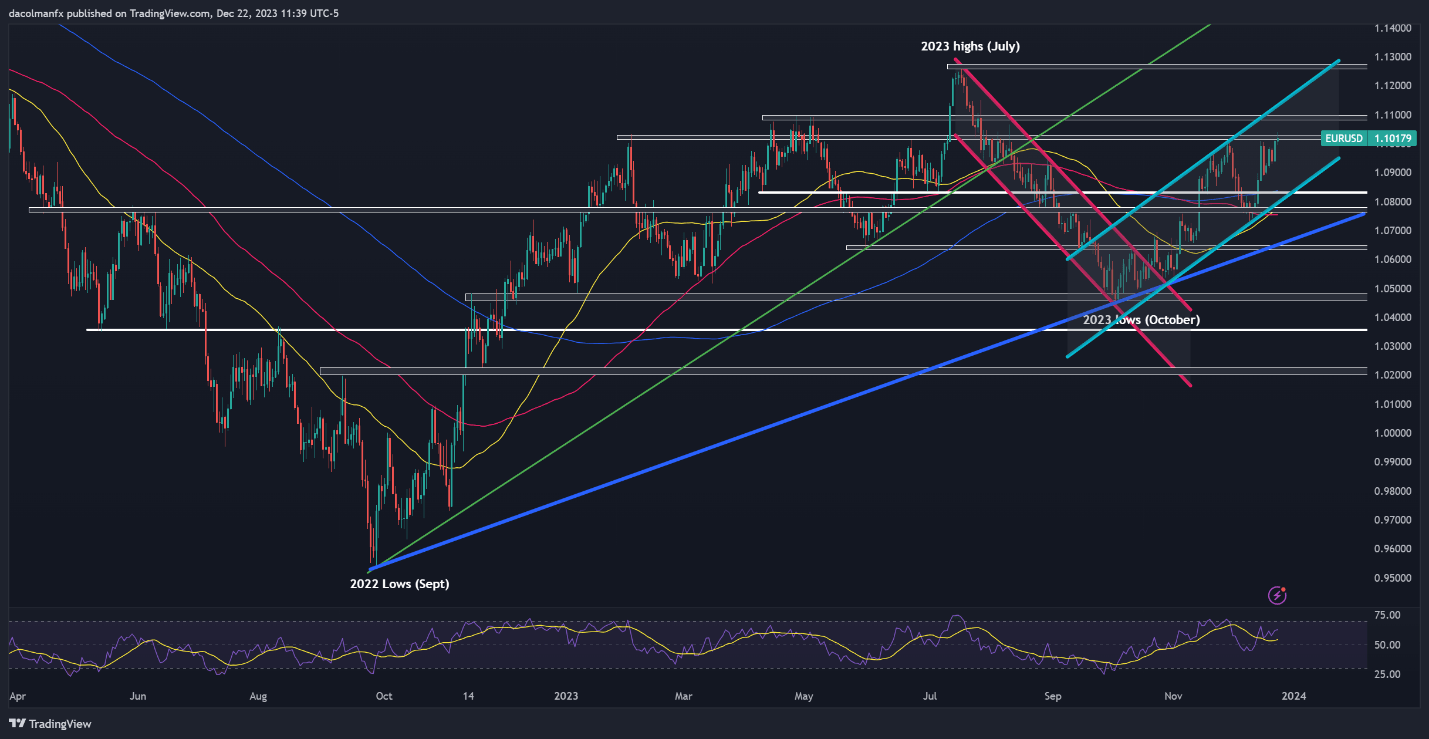
EUR/USD Chart Created Using TradingView
Interested in learning how retail positioning can shape GBP/USD’s path? Our sentiment guide explains the role of crowd mentality in FX market dynamics. Get the free guide now!
| Change in | Longs | Shorts | OI |
| Daily | -5% | -15% | -10% |
| Weekly | -10% | 3% | -5% |
GBP/USD TECHNICAL ANALYSIS
GBP/USD accelerated higher heading into the weekend, threatening to break above cluster resistance, which spans from 1.2727 to 1.2760, where a key Fibonacci threshold aligns with a downtrend line extended off the 2023 peak. Whether buyers will be able to muster the strength to push prices beyond this barrier remains to be seen, but in the event of a breakout, all eyes will be on 1.2840, followed by 1.3000.
Conversely, if sellers mount a resurgence and trigger a selloff during the last week of the year, the first defensive line against a pullback lies at 1.2600. Drawing from recent historical patterns, this floor might ward off a bearish assault, but a breach could send cable reeling towards the 200-day simple moving average near 1.2500. On further losses, the focus would shift to 1.2455.
GBP/USD TECHNICAL CHART
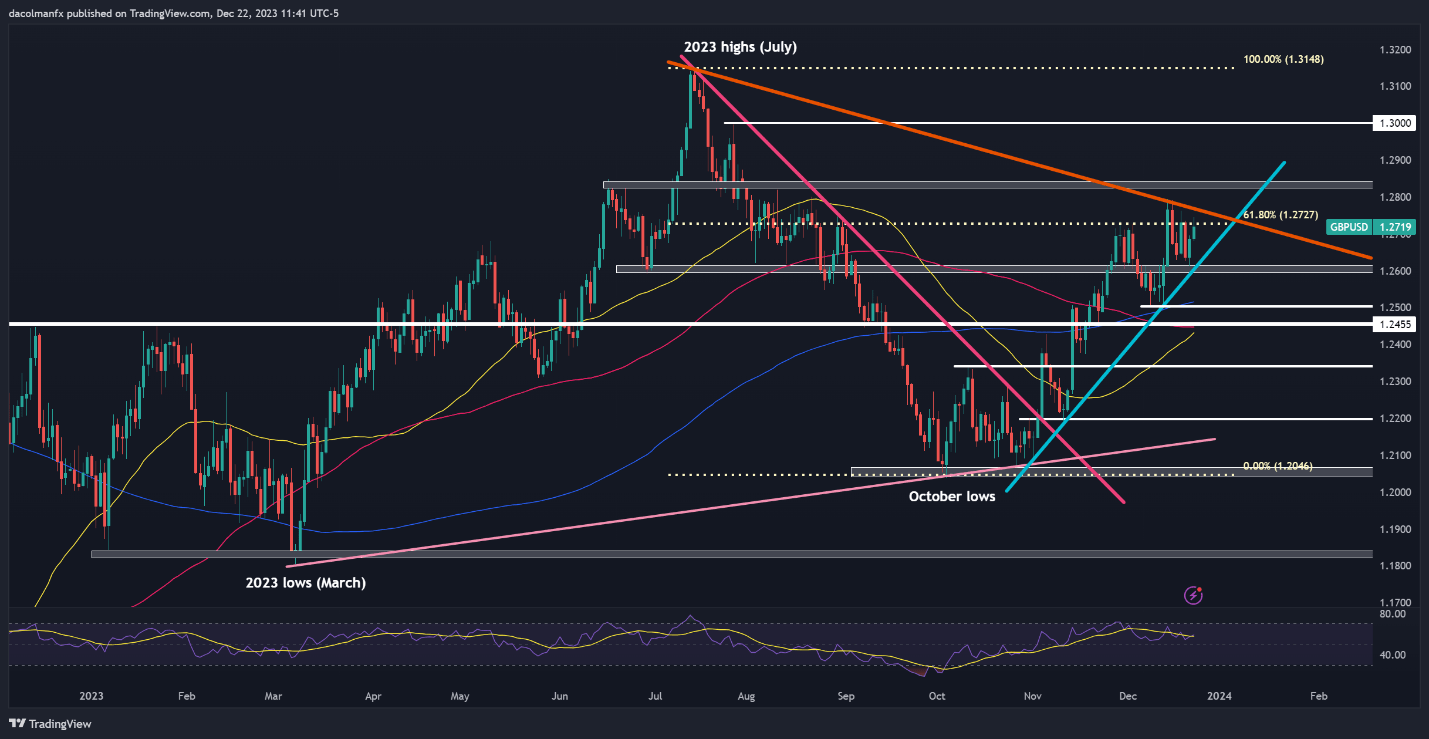
GBP/USD Chart Created Using TradingView
Obtain the essential knowledge for sustaining trading consistency. Get your hands on the "How to Trade Gold" guide for invaluable insights and tips!

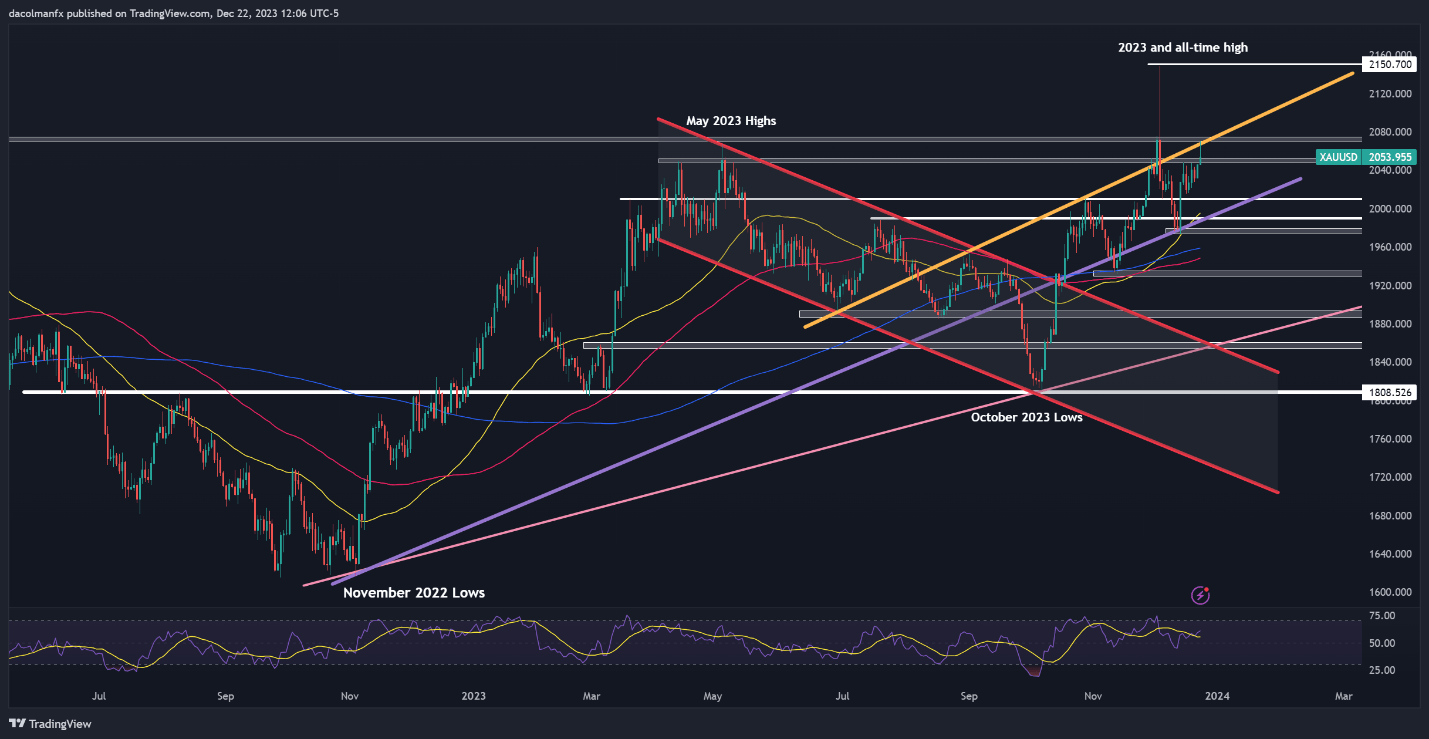
GOLD PRICE TECHNICAL ANALYSIS
Gold pushed past resistance on Friday, climbing above the $2,050 level but halted before breaching the $2,070-$2,075 threshold. Technical historical cues suggest XAU/USD could be rejected lower from this region, but a clean and clear breakout might invigorate bullish sentiment, enticing new buyers into the market and setting the stage for a retest of the all-time high at $2,150.
On the flip side, if buyers start heading for the exits and prices begin to trend to the downside, initial support appears at $2,050, followed by $2,010. Maintaining this last floor is vital for the bulls; a failure might revive bearish momentum, creating conditions for a drop towards $1,990. Below this area, the spotlight could be on $1,975.
GOLD PRICE TECHNICAL CHART