US DOLLAR FORECAST – GOLD PRICES, EUR/USD, GBP/USD
- The U.S. dollar, as measured by the DXY index, sinks to its lowest level since early August
- With U.S. yields biased to the downside and risk-on sentiment in full swing, the path of least resistance is lower for the greenback
- This article focuses on the technical outlook for EUR/USD, GBP/USD and gold, analyzing the main price thresholds to watch in the coming days
Trade Smarter - Sign up for the DailyFX Newsletter
Receive timely and compelling market commentary from the DailyFX team
Most Read: Russell 2000 Rises Toward Key Fibonacci Resistance. Will It Break Out This Time?
The U.S. dollar, as measured by the DXY index, sank nearly 0.65% to 101.75 on Thursday, hitting its lowest level since late July, with thinner liquidity ahead of the Christmas holidays possibly amplifying swings and, in this case, losses for the American currency.
The Federal Reserve’s pivot this month has been largely responsible for the greenback’s recent pullback. Although the Fed kept borrowing costs unchanged at its last meeting of the year, it signaled that it would slash rates several times in 2024, officially acknowledging that talk of easing its stance has begun.
The central bank’s dovish posture, which took many investors by surprise, has triggered a major slump in Treasury rates, sending the 2-year note below 4.40%, a significant retracement from the cycle high of 5.25%. The 10-year bond, for its part, has plunged beneath the 4.0% threshold, after being on the verge of topping 5% in late October.
Will the US dollar keep on falling or mount a bullish turnaround? Get all the answers in our quarterly outlook!

With U.S. yields biased to the downside and risk-on sentiment on full display in equity markets, the U.S. dollar may extend losses in the near term. This could mean more gains for gold prices, EUR/USD and GBP/USD moving into the last week of 2023.
While the greenback’s outlook could change next year if U.S. economic strength and lack of progress on inflation prevent rate cuts, the narrative is unlikely to change for the time being. New narratives take time to build and develop, and often require confirmation from data to gain traction.
Stay ahead of the curve and improve your trading prowess! Download the EUR/USD forecast for a thorough overview of the pair’s technical and fundamental outlook.

EUR/USD TECHNICAL ANALYSIS
EUR/USD is pressing against cluster resistance near the 1.1000 handle after Thursday’s rally. If buyers manage to propel prices above this technical barrier in the coming trading sessions, a potential move toward 1.1085 might be on the cards. On further strength, the focus shifts higher to 1.1125, which corresponds to the upper boundary of a short-term rising channel.
Conversely, if the pair gets rejected at resistance and sellers return in force to exploit the reversal, initial support is located around 1.0830, near the 200-day simple moving average. This region might offer a potential foothold during a retracement ahead of a rebound, but a move below it could be ominous, paving the way for a drop toward channel support at 1.0770.
EUR/USD TECHNICAL CHART
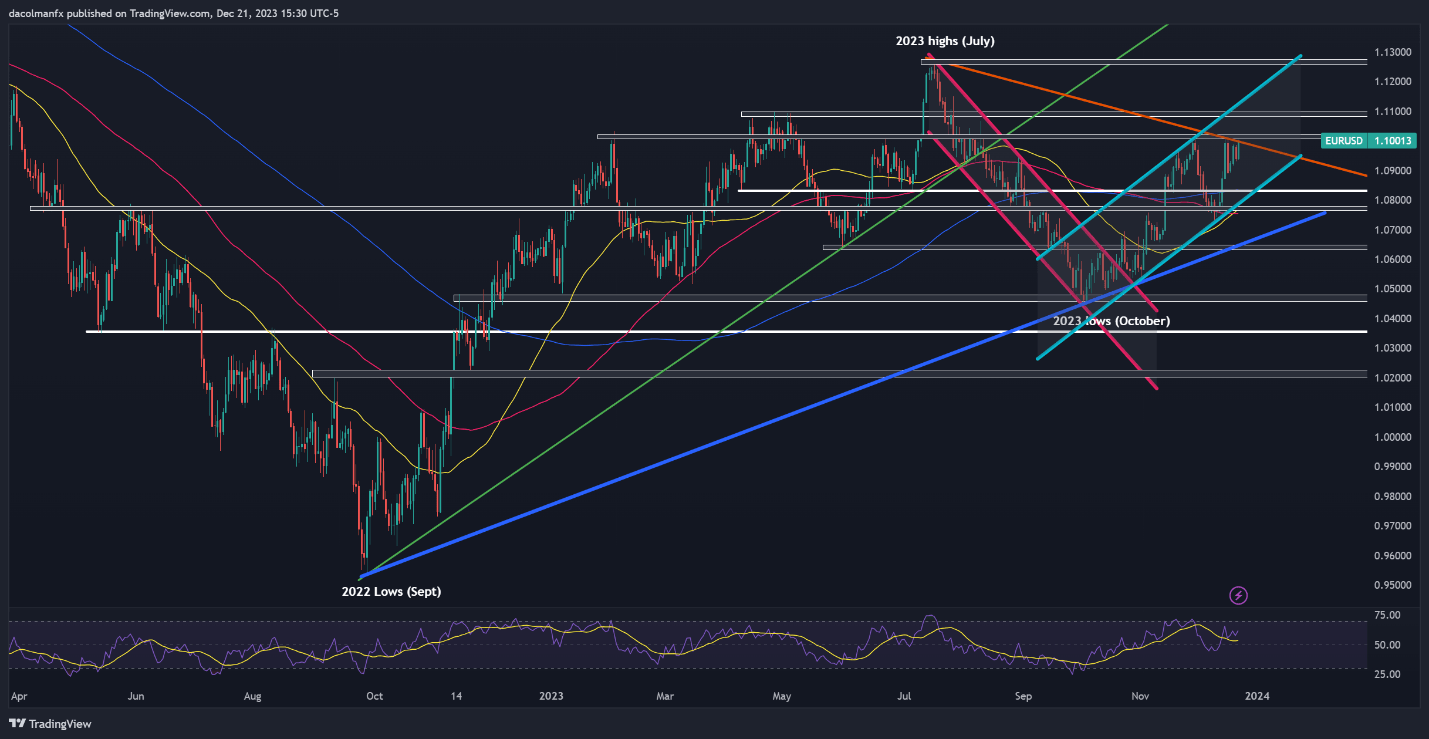
EUR/USD Chart Created Using TradingView
Interested in learning how retail positioning can shape GBP/USD’s path? Our sentiment guide explains the role of crowd mentality in FX market dynamics. Get the free guide now!
| Change in | Longs | Shorts | OI |
| Daily | -1% | 14% | 6% |
| Weekly | -11% | 10% | -1% |
GBP/USD TECHNICAL ANALYSIS
After some softness earlier in the week, GBP/USD managed to rebound off confluence support around the 1.2600 mark, consolidating above the 1.2700 threshold on Thursday. If gains accelerate heading into the weekend, the first technical barrier to overcome stretches from 1.2727 to 1.2760. Based on historical patterns, prices might face resistance in this range, but a breakout could propel the pair towards 1.2840.
In the event of a bearish reversal, potentially magnified by low holiday trading volume, the first defensive line against a pullback is located around the 1.2600 handle, as previously articulated. Should this floor cave in, attention will gravitate towards the psychological 1.2500 level near the 200-day simple moving average, followed by 1.2455.
GBP/USD TECHNICAL CHART
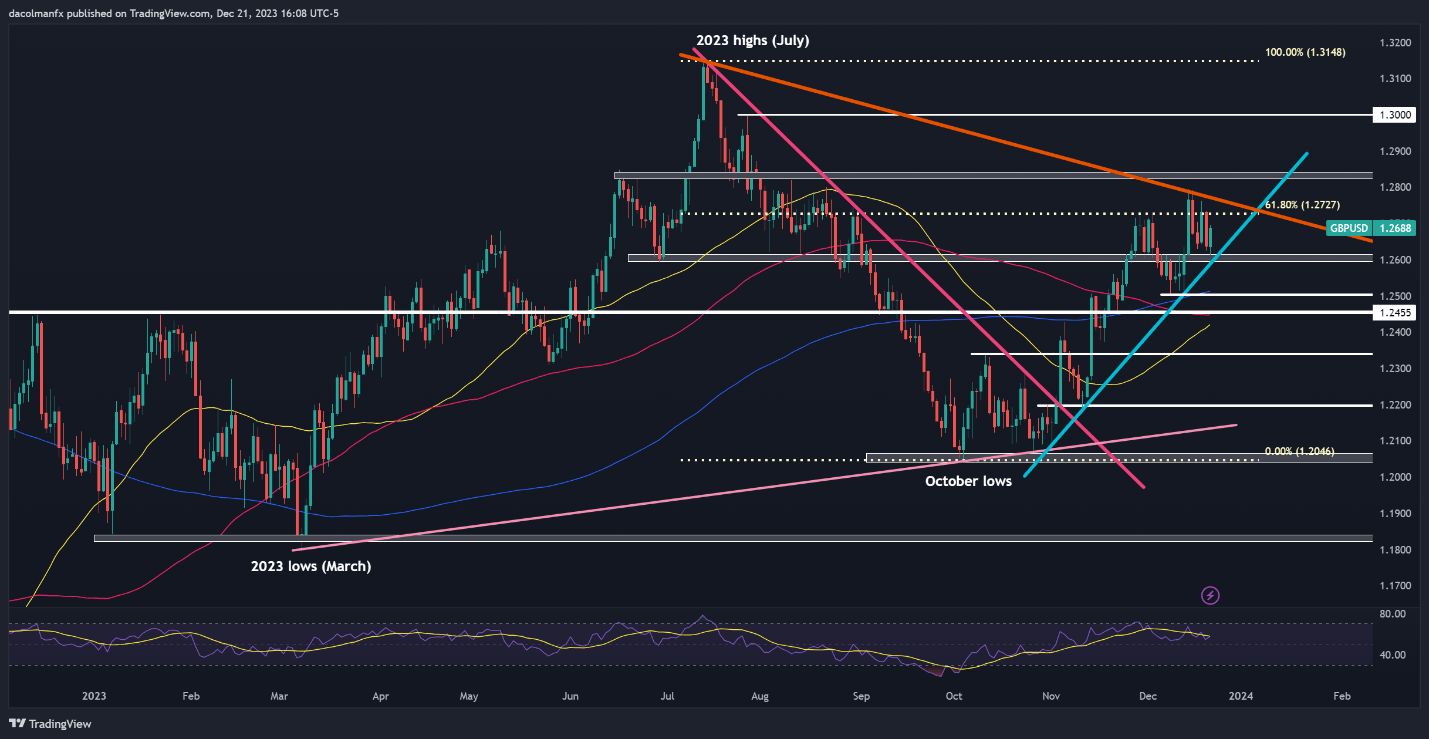
GBP/USD Chart Created Using TradingView
Acquire the knowledge needed for maintaining trading consistency. Grab your "How to Trade Gold" guide for invaluable insights and tips!

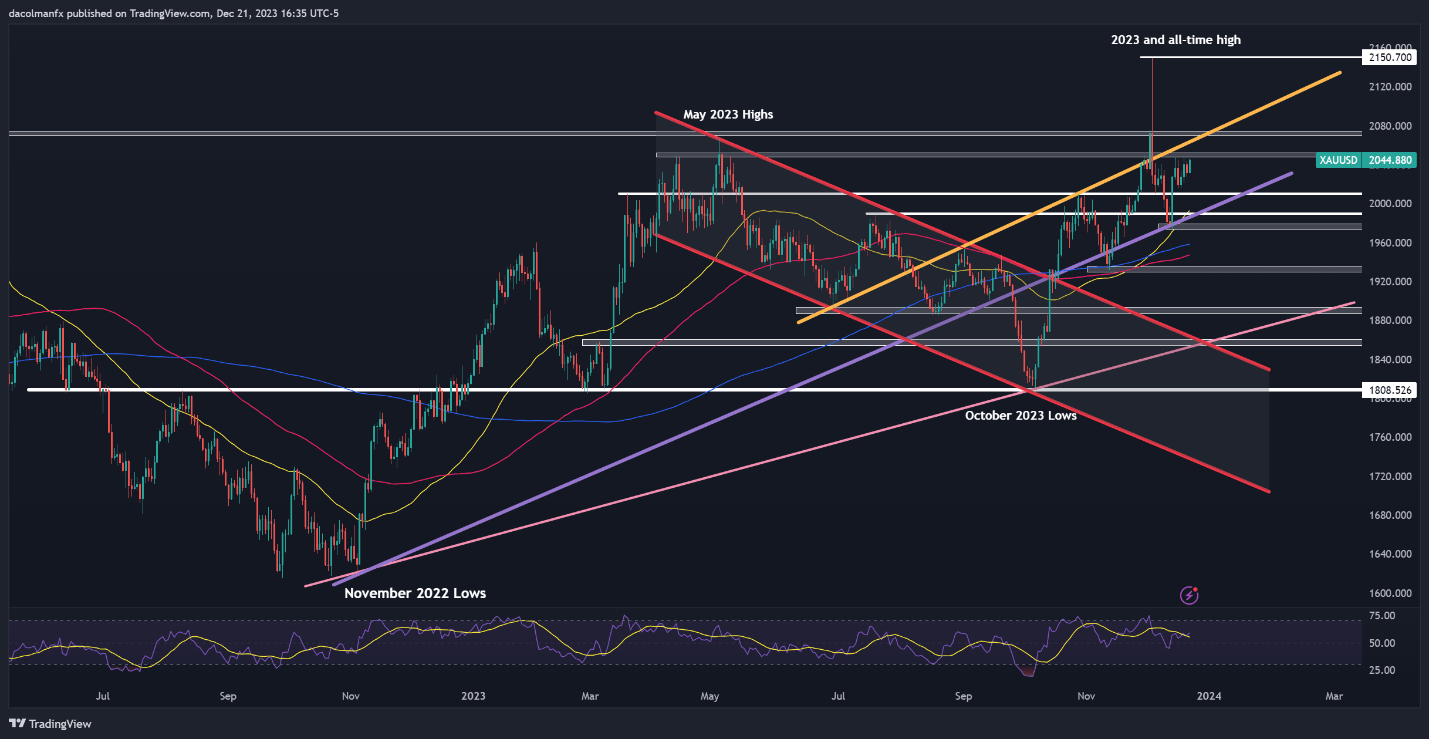
GOLD PRICE TECHNICAL ANALYSIS
Gold fell sharply early this month when a fakeout devolved into a large selloff, but has regained ground in recent days after bouncing off trendline support at $1,975, with bullion currently approaching $2,050 – a key resistance. If history is any guide, prices could be rejected from this area, but a breakout could open the door to a retest of $2,075. Continued strength could bring back focus on the all-time high at $2,150.
On the other hand, if the recovery stalls and XAU/USD pivots lower, technical support emerges at $2,010. Maintaining this floor is imperative for the bulls; a failure to do so could reinforce downward momentum, sending the precious metal reeling toward trendline support near $1,990. Below this threshold, the crosshairs will be on $1,975.
GOLD PRICE TECHNICAL CHART