US DOLLAR FORECAST - EUR/USD, USD/JPY, GBP/USD
- The U.S. dollar weakens across the board as the Federal Reserve signals numerous rate cuts for next year
- The FOMC’s dovish policy outlook sends Treasury yields tumbling
- This article focuses on the technical outlook for EUR/USD, USD/JPY and GBP/USD in the wake of the Fed’s tentative pivot
Most Read: Fed Stays Put, Sees Three Rate Cuts in 2024; Gold Prices Soar as Yields Plunge
The U.S. dollar, as measured by the DXY index, plummeted nearly 0.9% on Wednesday, dragged lower by the massive plunge in U.S. Treasury rates after the Federal Reserve’s guidance surprised on the dovish side, catching investors, who were anticipating a different outcome, off guard and on the wrong side of the trade.
For context, the U.S. central bank today concluded its last meeting of the year. Although policymakers kept borrowing costs unchanged at multi-decade highs, they gave the first signs of an impending strategy pivot by embracing a more benevolent characterization of inflation and admitting that talk of rate cuts has begun.
Will the US dollar keep falling or reverse higher? Get all the answers in our quarterly outlook!

The Fed’s Summary of Economic Projection reinforced the view that a policy shift is on the horizon, with the dot plot showing 75 basis points of easing next year, far more than contemplated in September. While Wall Street’s rate-cut wagers have been extreme, the Fed's forecasts are slowly converging toward the market's outlook – this should be bearish for the greenback and yields moving into 2024.
With the broader U.S. dollar in a tailspin, EUR/USD soared towards the 1.0900 handle while GBP/USD jumped past an important ceiling near 1.2600. Meanwhile, USD/JPY nosedived, rapidly falling towards its 200-day simple moving average – the last line of defense against a larger retreat.
This article focuses on the technical outlook for major U.S. dollar pairs such as EUR/USD, USD/JPY and GBP/USD, examining key price levels after Wednesday’s outsize moves in the FX space.
For a complete overview of the euro’s technical and fundamental outlook, download your complimentary trading forecast now!

EUR/USD TECHNICAL ANALYSIS
EUR/USD jumped on Wednesday, clearing technical resistance near 1.0830, corresponding to the 200-day simple moving average. If this bullish move is sustained in the coming days, the upside momentum could accelerate, setting the stage for a rally towards 1.0960, the 61.8% Fib retracement of the July/October decline. On further strength, attention would shift towards 1.1015, last month's high.
On the other hand, if the upward impetus fades and prices resume their descent, the first support to monitor is located at 1.0830, but further losses could be in store for the pair on a push below this threshold, with the next area of interest at 1.0765. Continued weakness might draw focus towards trendline support, currently traversing the 1.0640 region.
EUR/USD TECHNICAL CHART
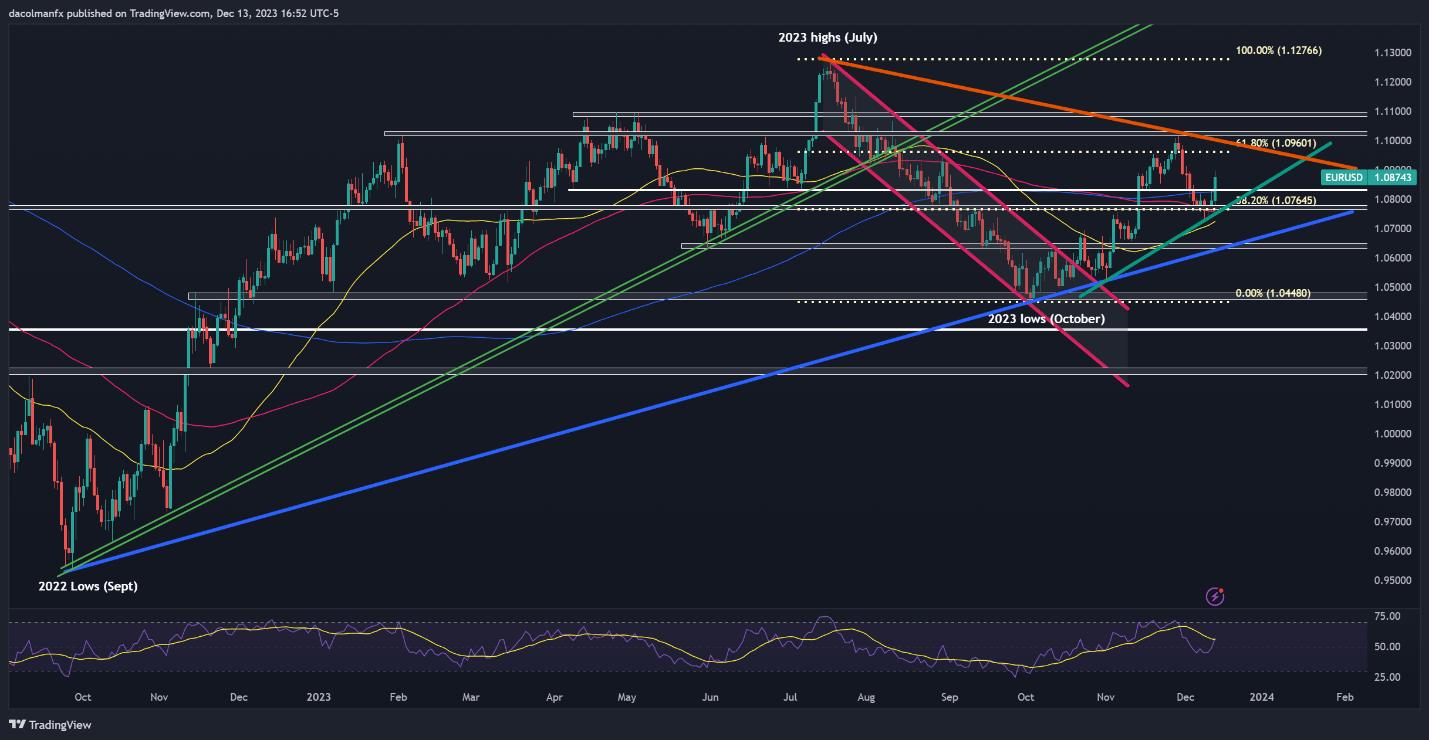
EUR/USD Chart Prepared Using TradingView
For tips and expert insights on how to trade USD/JPY, download the yen’s guide!

USD/JPY TECHNICAL ANALYSIS
USD/JPY saw an upward push earlier this week, but this ascent hit an abrupt halt on Wednesday when the Fed triggered a massive U.S. dollar selloff. This drove the pair sharply lower, sending the exchange rate towards its 200-day SMA, the next major floor to watch. Bulls will need to staunchly defend this floor; failure to do so could spark a drop towards 141.70 and 140.70 thereafter.
Conversely, if USD/JPY resumes its rebound, technical resistance looms at 144.50. Buyers may have a difficult time breaching this barrier, but if they manage to drive prices above this ceiling, we could see a rally towards the 146.00 handle. On further strength, all eyes will be on 147.20.
USD/JPY TECHNICAL CHART
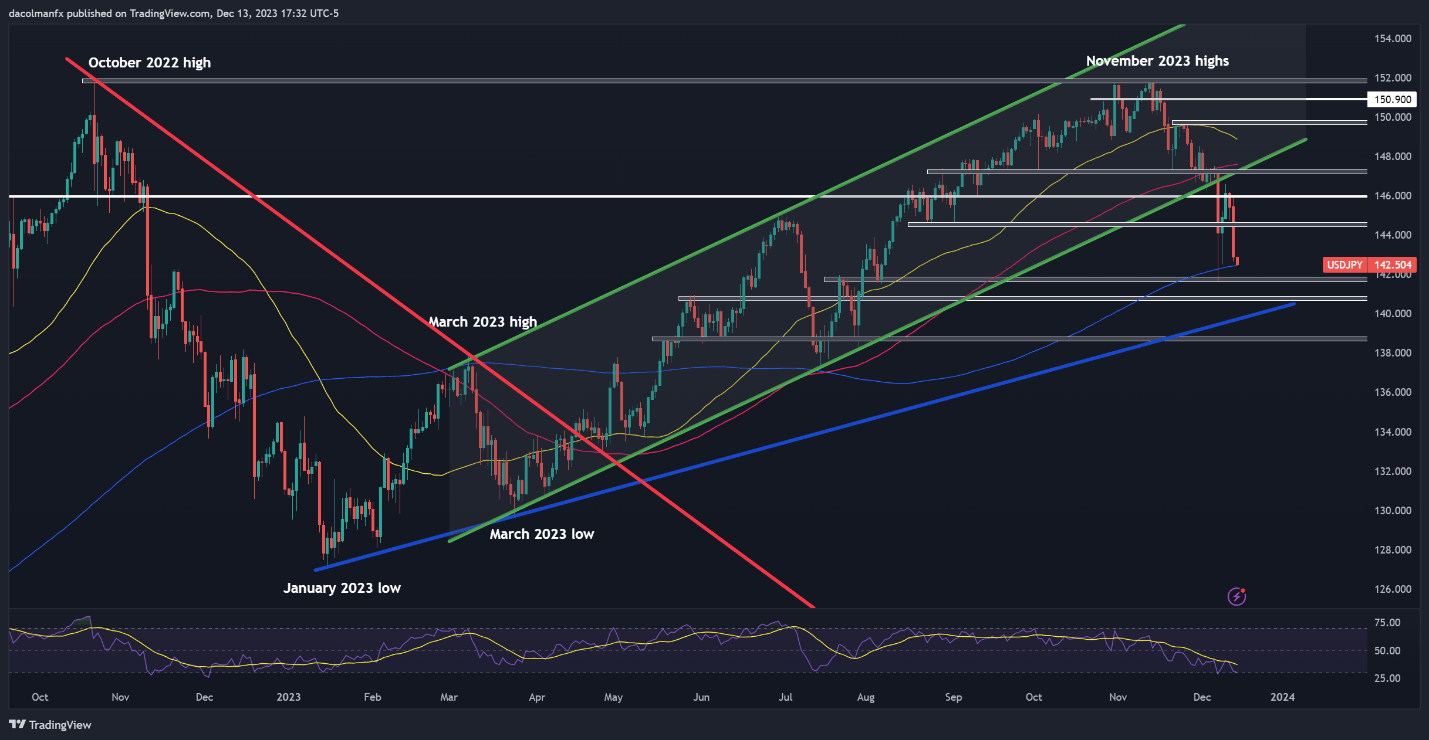
USD/JPY Chart Created Using TradingView
Keen to understand the role of retail positioning in GBP/USD’s price action dynamics? Our sentiment guide delivers all the essential insights. Get your free copy now!
| Change in | Longs | Shorts | OI |
| Daily | -9% | 3% | -4% |
| Weekly | -8% | 5% | -2% |
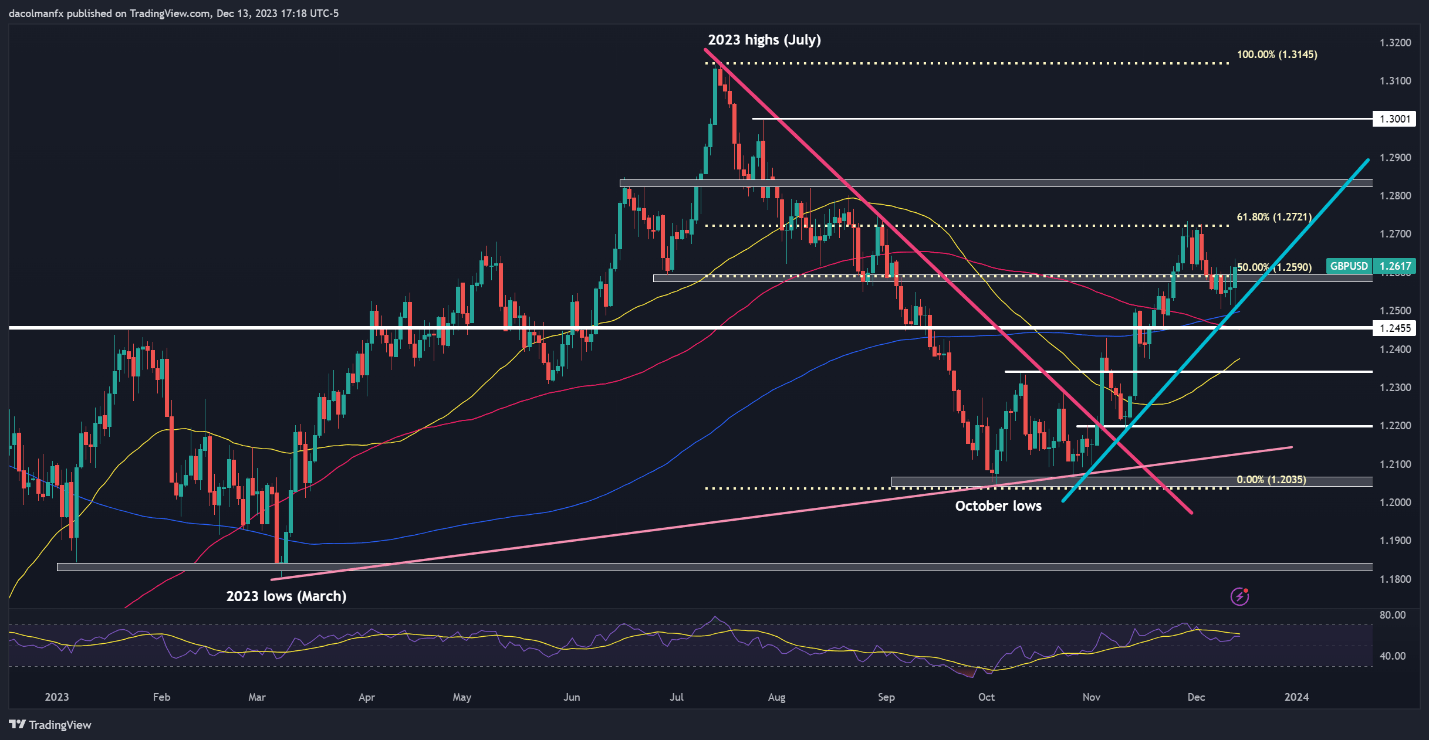
GBP/USD TECHNICAL ANALYSIS
GBP/USD climbed and pushed past resistance at 1.2590 on Wednesday after bouncing off trendline support near 1.2500, with the advance reinforced by the broader U.S. dollar downturn. If the pair manages to hold onto recent gains and consolidates to the upside little by little, we could soon see a retest of 1.2720 level, the 61.8% Fib of the July/October retracement. Further up, all eyes will be on 1.2800.
On the other hand, if sellers return and trigger a bearish reversal, initial support appears at 1.2590, followed by 1.2500, near the 200-day simple moving average. Looking lower, the focus turns to 1.2455. Cable is likely to stabilize in this region on a pullback before mounting a possible comeback, but in the event of a breakdown, a move down to 1.2340 becomes a plausible scenario.
GBP/USD TECHNICAL CHART