
US DOLLAR FORECAST
- The U.S. dollar extends its retracement on Thursday, dragged lower by falling U.S. Treasury yields
- The Fed’s pivot has sparked a dovish repricing of interest rate expectations
- This article examines the technical outlook for EUR/USD and USD/JPY
Most Read: US Dollar Sinks on Fed Dovish Pivot, Setups on EUR/USD, USD/JPY, GBP/USD
The U.S. dollar, as measured by the DXY index, extended its retracement on Thursday, sinking below that 102.00 mark and reaching its lowest level since early August. This selloff was the result of the collapse in U.S. Treasury yields, triggered by the Fed’s dovish posture at its December meeting, which seems to have caught investors, who were expecting a different outcome, completely off guard.
To provide background information, the FOMC announced yesterday its last monetary policy decision of the year. Although the institution kept borrowing costs unchanged at a 22-year high, it gave the first signs of an impending strategy shift, with Powell reinforcing the idea of a pivot by admitting that talk of rate cuts has begun.
The Fed’s Summary of Economic Projection was also quite dovish, indicating 75 basis points of easing in 2024 and 100 basis points in 2025, a steeper path of rate cuts than contemplated in September. Against this backdrop, yields have plummeted in a matter of days, triggering a large downward shift in the Treasury curve, as highlighted in the chart below, fostering a bearish environment for the greenback.
Will the US dollar keep dropping or reverse to the upside? Get all the answers in our quarterly outlook!

US TREASURY YIELD CURVE
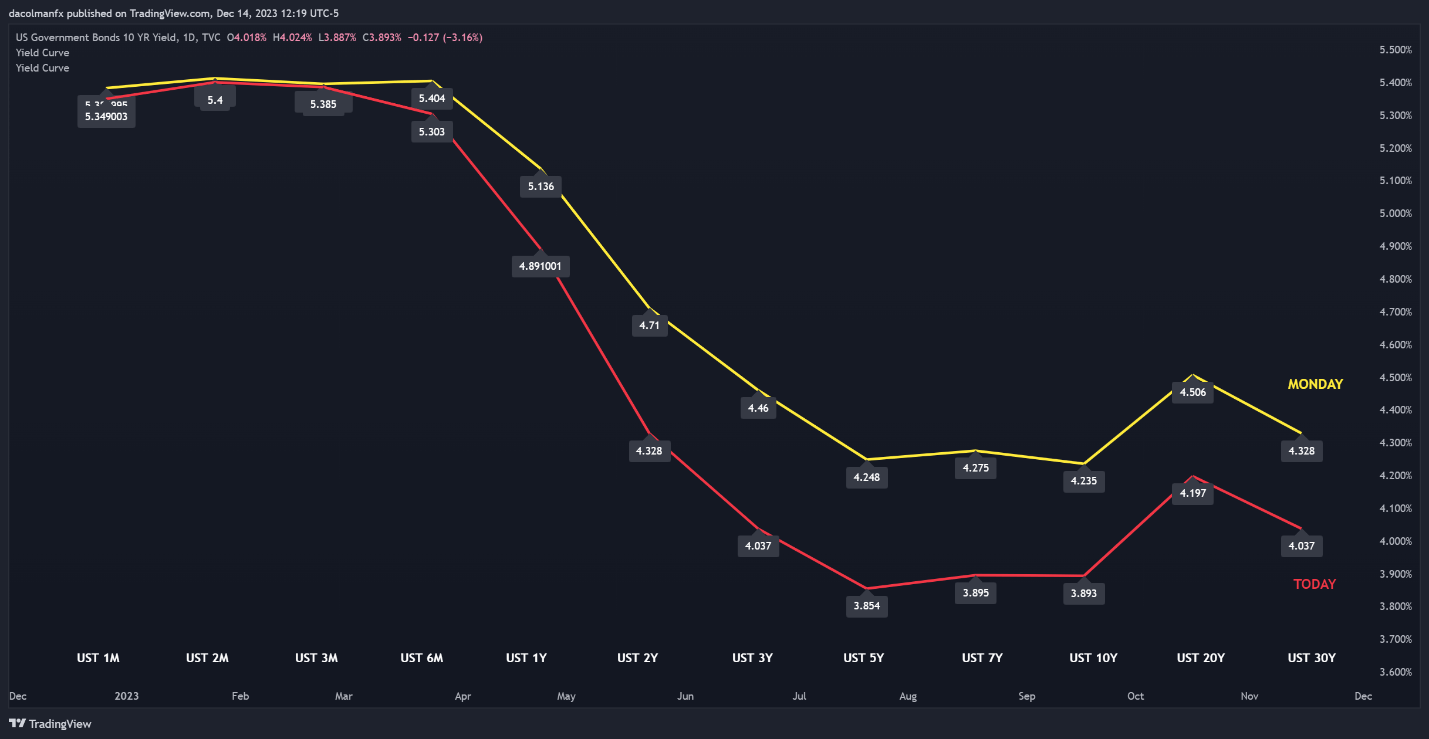
Source: TradingView
With the broader U.S. dollar in freefall, EUR/USD has rallied back towards the 1.1000 handle, with gains boosted by the ECB’s less dovish relative stance compared to that of the FOMC. GBP/USD has also soared, reaching its strongest levels in nearly four months. Meanwhile, Meanwhile, USD/JPY has plummeted below its 200-day simple moving average, activating a bearish signal for the pair.
Stay ahead of the curve! Request your complimentary EUR/USD trading forecast for a thorough overview of the pair’s technical and fundamental outlook

EUR/USD TECHNICAL ANALYSIS
EUR/USD extended its advance on Thursday, breaking above a key Fibonacci ceiling and pushing towards cluster resistance in the 1.1015 area. With bullish momentum in its favor, the pair could soon breach this barrier, paving the way for a rally towards 1.1090. On further strength, we can't rule out the possibility of a retest of the July highs.
Conversely, if the upward impetus diminishes and prices shift downwards, initial support zone to keep in view rests around 1.0830, which coincides with the 200-day simple moving average. There's potential for the exchange rate to stabilize near these levels on a pullback before resuming its ascending trajectory; however, a clean and decisive breakdown might lead to a decline towards 1.0765.
EUR/USD TECHNICAL CHART
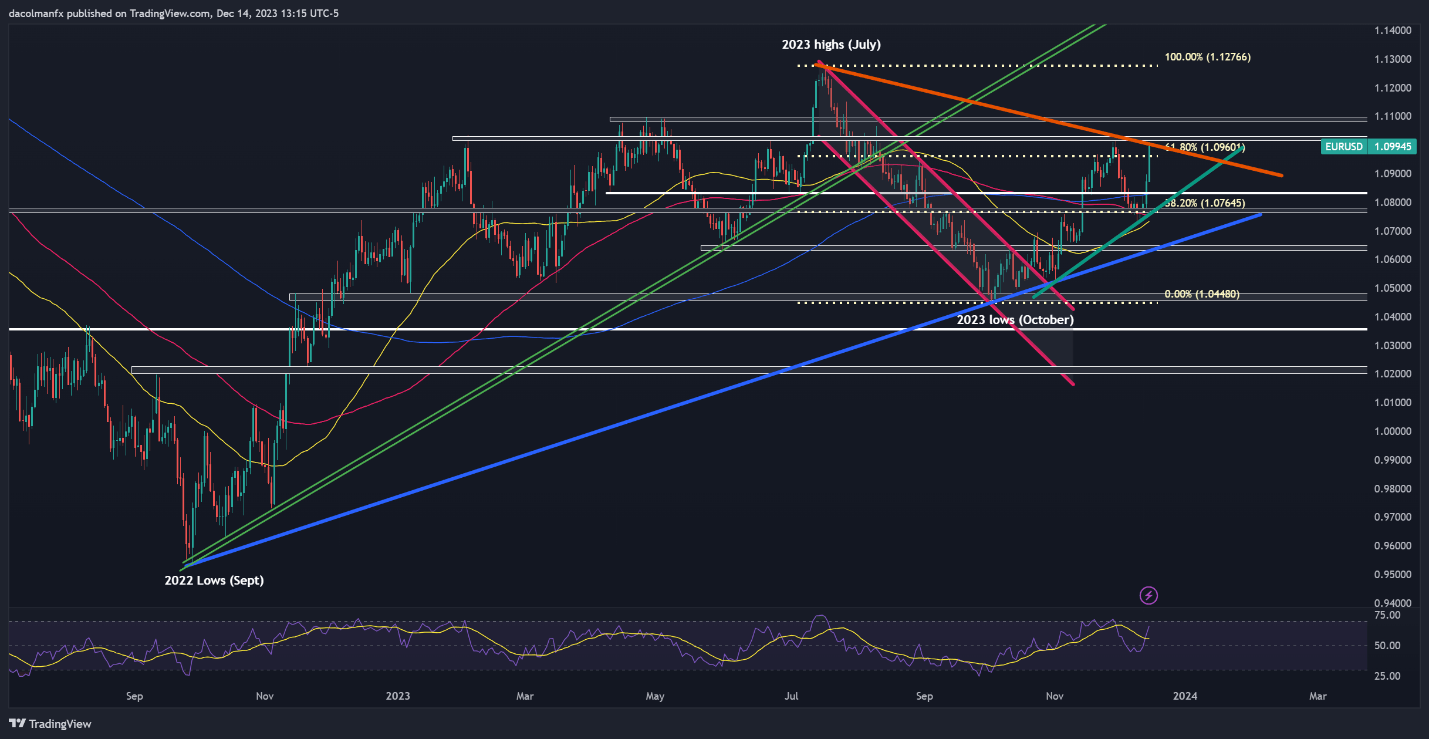
EUR/USD Chart Prepared Using TradingView
Interested in learning how retail positioning can shape the short-term trajectory of USD/JPY? Our sentiment guide explains the role of crowd mentality in FX market dynamics. Get the guide now!
| Change in | Longs | Shorts | OI |
| Daily | 13% | -19% | -13% |
| Weekly | 31% | -30% | -21% |
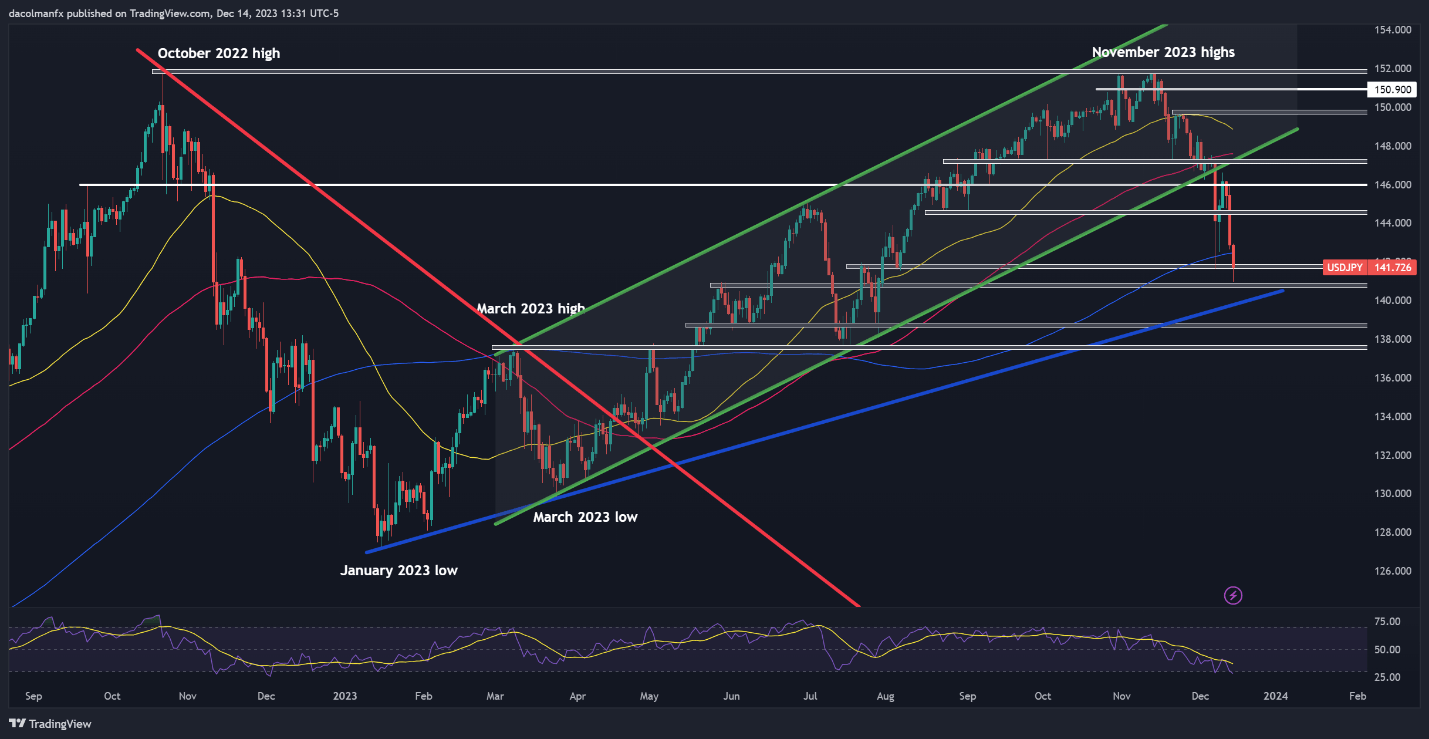
USD/JPY TECHNICAL ANALYSIS
USD/JPY plummeted on Thursday, breaking below its 200-day simple moving average and briefly hitting its weakest point since late July near 140.70. This technical floor must hold at all costs; otherwise, sellers could become emboldened to launch a bearish attack on trendline support at 139.75. Further weakness could prompt a move towards 137.50.
On the other hand, if USD/JPY resumes its rebound unexpectedly, overhead resistance is located at 142.45 and 144.60 thereafter. Buyers might encounter challenges propelling the exchange rate above the latter threshold, but breaching it could trigger a rally towards the 146.00 handle. Continued upward momentum would draw attention to 147.20.
USD/JPY TECHNICAL CHART