
RUSSELL 2000 FORECAST
- The Russell 2000 rebounds following Wednesday’s selloff
- While the small-cap equity index appears overbought and prone to a pullback in the near term, the medium-term outlook remains constructive
- This article looks at the Russell 2000’s key technical levels worth watching in the coming days
Trade Smarter - Sign up for the DailyFX Newsletter
Receive timely and compelling market commentary from the DailyFX team
Most Read: US Q3 GDP Revised Lower Dragging the Dollar Index Along, Gold Rises
After Wednesday's selloff, the Russell 2000 rebounded moderately on Thursday, along with the Nasdaq 100 and S&P 500, coming within striking distance from breaching an important technical ceiling at 2,050, as FOMO mentality prevailed, with traders trying to take advantage of positive sentiment in the financial markets.
The recent pivot by the Federal Reserve during its December monetary policy meeting has created a more benign environment for small-cap stocks. By prioritizing growth over inflation and hinting at multiple rate cuts in 2024, policymakers have likely steered the country away from a downturn. This unexpected move has tilted the scales in favor of a soft landing, improving prospects for corporate earnings in the coming year.
The ripple effects of the U.S. central bank’s dovish posture have been very noticeable. Financial conditions, for instance, have eased dramatically, sending yields tumbling and the main U.S. equity indices toward fresh records. The upswing in asset values, if sustained, should create a virtuous cycle for the economy, magnifying the wealth effect and boosting household spending – the main driver of GDP.
If you are discouraged by trading losses, why not take a proactively positive step towards improvement? Download our guide, "Traits of Successful Traders," and access invaluable insights to assist you in avoiding common trading errors

Although stocks appear to be overbought, the improving economic outlook will provide continued support heading into 2024. This suggests that the recent bull run is likely to continue, perhaps after a brief period of market consolidation.
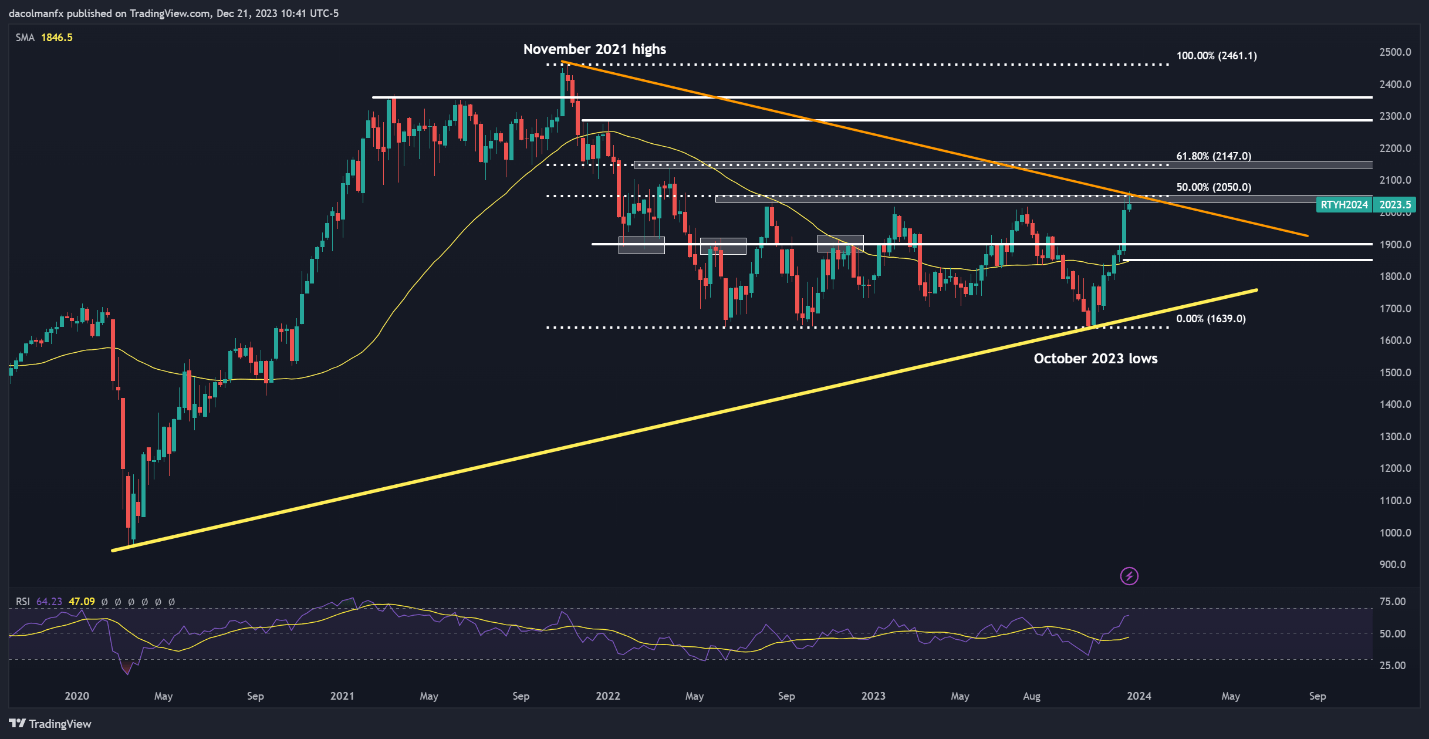
From a technical analysis standpoint, the Russell 2000 is moving closer toward an important resistance near 2,050, established by the 50% Fibonacci retracement of the November 2021/October 2023 slump. Sellers will defend this barrier tooth and nail based on historical precedent, but in the event of a breakout, a potential rally towards 2,147, representing the 61.8% Fib retracement, could ensue.
On the flip side, if the bears regain control of the market and spark a reversal lower, the Russell 2000 may gravitate towards the psychological 1,900 level. While the small-cap index could find stability in this area before resuming its upward trajectory, a breakdown could pave the way for a more significant retreat, with the 50-week simple moving average at 1,850 acting as the next floor.
If you are looking for a more comprehensive view of U.S. equity indices, our quarterly stock market trading guide is packed with great insights. Grab your free copy now!

RUSSELL 2000 WEEKLY CHART