


USD/CAD ANLAYSIS & TALKING POINTS
- Elevated crude oil prices keep CAD bulls hopeful.
- US factors dominate FX landscape.
- Conflicting signals on daily USD/CAD.
Trade Smarter - Sign up for the DailyFX Newsletter
Receive timely and compelling market commentary from the DailyFX team
CANADIAN DOLLAR FUNDAMENTAL BACKDROP
The Canadian dollar enters the US trading session on the front foot after the loonie traded mostly lower throughout the European session against the US dollar. Hawkish Fed speak from Neel Kashkari who reinforced his aggressive monetary policy outlook including an additional interest rate hike (2023) while holding rates steady in 2024. US durable goods orders beat estimates ( see economic calendar below) but the decline in mortgage applications shows the interest rate pressure on individuals to enter into the US housing market. The pair has been largely impacted by US specific factors this week with no high impact Canadian data alongside crude oil movements.
Once again, crude oil prices are pushing higher today despite the stronger greenback. The EIA weekly inventory data will be released later on today and should provide some short-term volatility around oil prices and the CAD.
USD/CAD ECONOMIC CALENDAR (GMT +02:00)
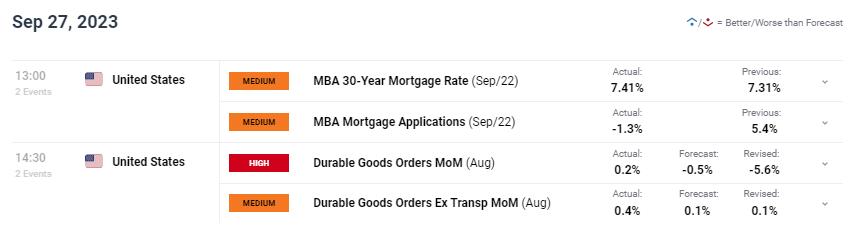
Source: DailyFX Economic Calendar
TECHNICAL ANALYSIS
USD/CAD DAILY CHART
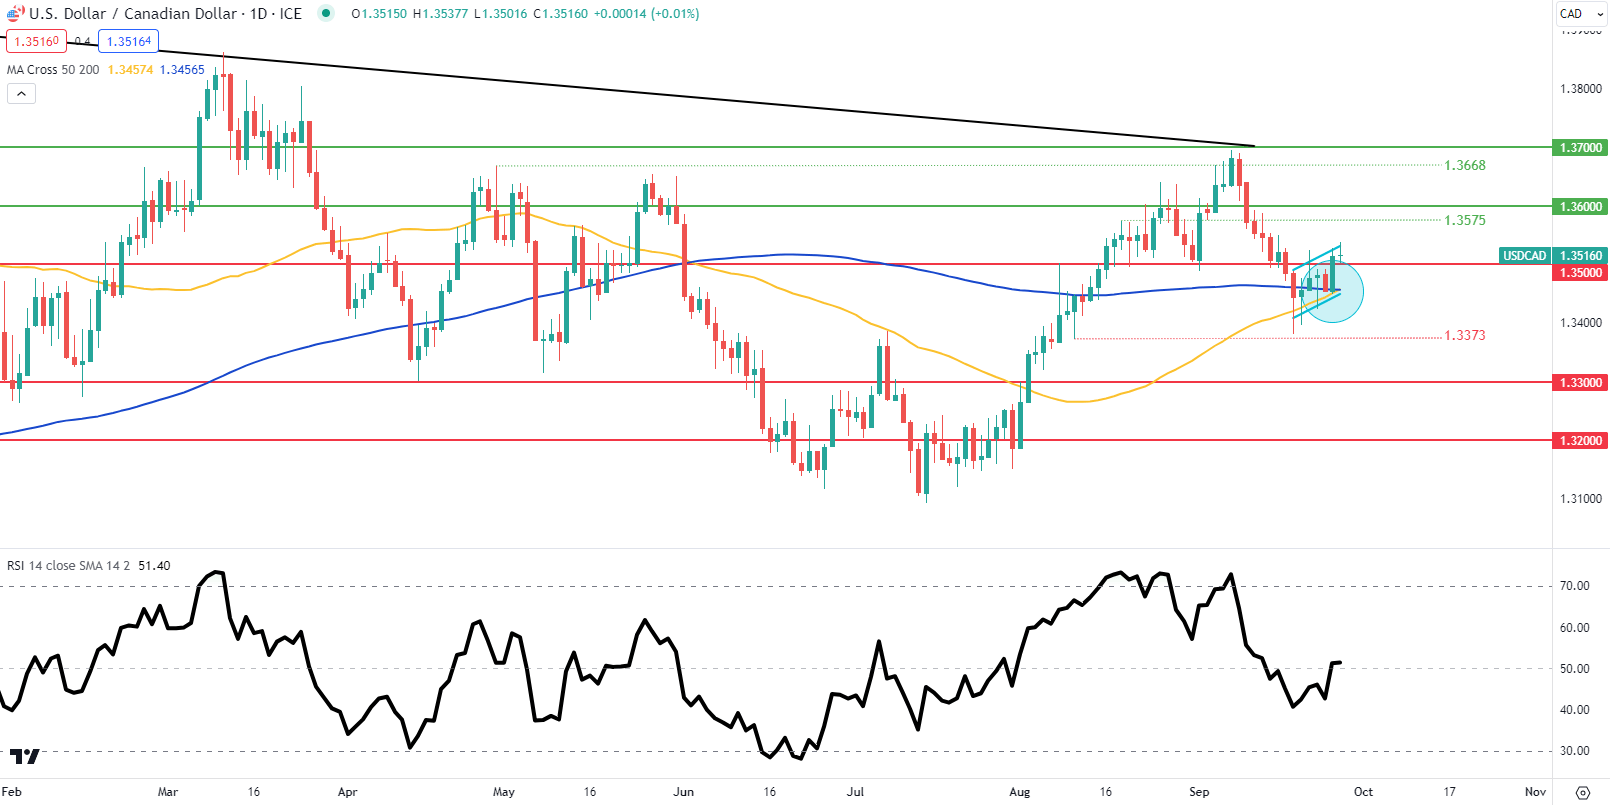
Chart prepared by Warren Venketas, IG
Daily USD/CAD price action is at a precarious position reflected by the Relative Strength Index (RSI) where momentum favors neither bulls nor bears. The moving averages look to be forming a golden cross (50-day crossing above the 200-day MA); a bullish signal while the recent daily candlesticks resemble a bear flag (light blue) chart pattern. The pattern will be invalidated should we see a daily confirmation close above flag resistance; however, a break beneath flag support and the aforementioned MA’s will expose the 1.3373 swing low.
Introduction to Technical Analysis
Moving Averages
Recommended by Warren Venketas
Key resistance levels:
- 1.3575
- Flag resistance
Key support levels:
- 1.3500
- 200-day MA
- 50-day MA
- 1.3373
- 1.3300
IG CLIENT SENTIMENT DATA: MIXED
IGCS shows retail traders are currently neither LONG or SHORT on USD/CAD , with 50% of traders currently split between the two (as of this writing). Download the latest sentiment guide (below) to see how daily and weekly positional changes affect USD/CAD sentiment and outlook!
Introduction to Technical Analysis
Market Sentiment
Recommended by Warren Venketas
Contact and followWarrenon Twitter:@WVenketas


