
JAPANESE YEN FORECAST:
- The Japanese yen has depreciated significantly against its top peers recently, weighed by BoJ’s dovish monetary policy
- USD/JPY continues its advance towards the 145.00 handle, with rising U.S. yields bolstering the U.S. dollar performance
- Meanwhile, GBP/JPY wavers at 184.00 as the market becomes stretched and prices approach major technical resistance

Most Read: Gold Prices Teeter on Brink of Breakdown as US Yields Fly High Following US Data
The Japanese yen was subdued in FX markets on Thursday, as traders remained overly pessimistic about the currency’s outlook following the Bank of Japan's decision to maintain an ultra-loose monetary policy posture at its June meeting.
Against the U.S. dollar, the yen weakened moderately, with USD/JPY receiving a further boost from soaring U.S. Treasury yields after better-than-expected U.S. economic data increased the likelihood of additional tightening by the Fed in the coming months.
Compared to the British pound, the yen also depreciated, but losses were more limited. That said, GBP/JPY was up 0.15% to 182.80 in early afternoon trading, nearing its multi-year highs briefly reached earlier in the week.
USD/JPY and GBP/JPY are discussed below from a technical analysis perspective, recognizing that price action can offer important clues about sentiment and insight into the near-term trend.

USD/JPY TECHNICAL ANALYSIS
USD/JPY extended its advance on Thursday, climbing more than 0.3% and coming within striking distance from reclaiming the psychological 145.00 handle, a key technical barrier to watch for near-term directional bias signals.
With upside momentum on its side, the path of least resistance is higher for the dollar. This means that the pair is likely to stage a bullish breakout soon, an event that could create the right conditions for a rally toward 147.50, followed by 148.75.
On the flip side, if USD/JPY fails to clear the 145.00 threshold and turns lower, initial support appears at 142.50. While prices may bottom out around these levels before rebounding, a breakdown could lure new sellers to the market, setting the stage for a pullback toward 140.75
| Change in | Longs | Shorts | OI |
| Daily | -14% | 1% | -3% |
| Weekly | -12% | -7% | -9% |
USD/JPY TECHNICAL CHART
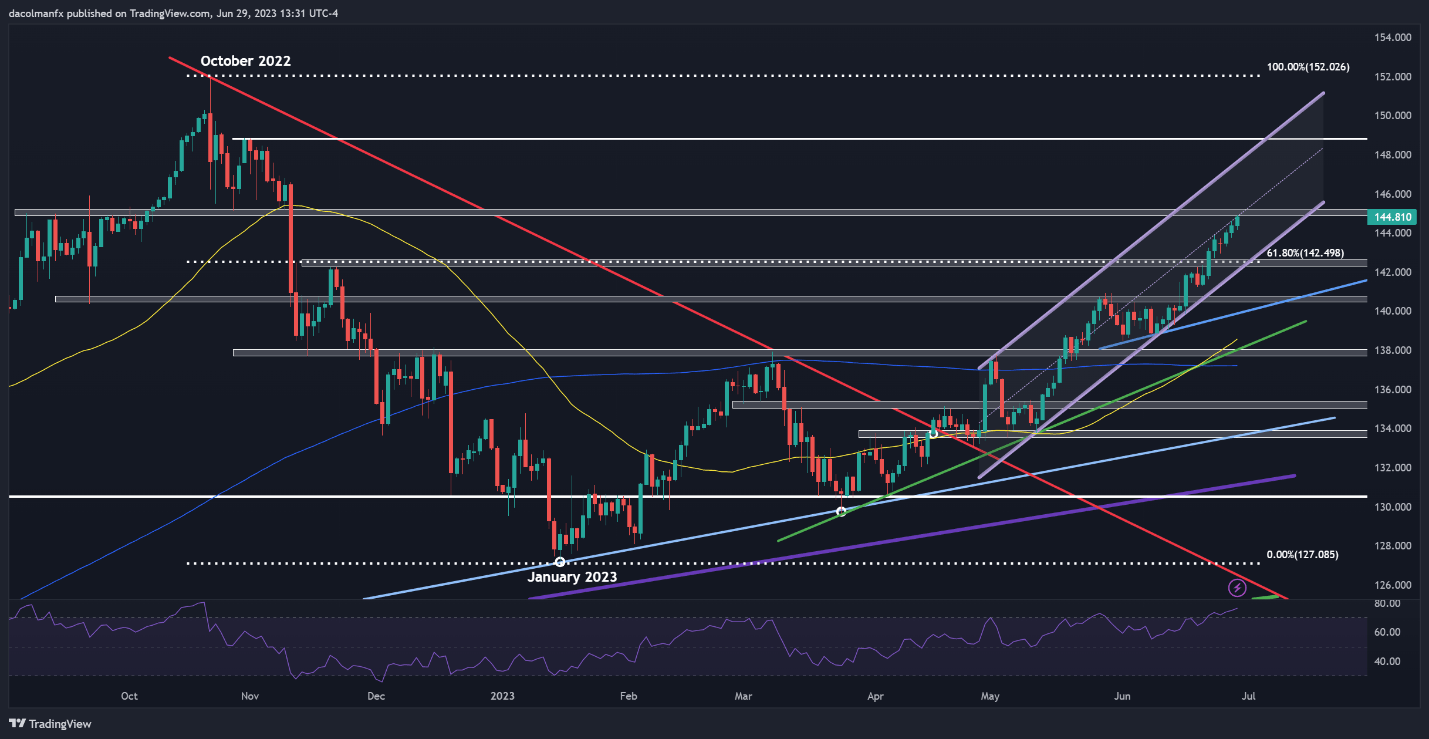
USD/JPY Chart Created Using TradingView
| Change in | Longs | Shorts | OI |
| Daily | 8% | -3% | -1% |
| Weekly | -27% | 9% | -3% |
GBP/JPY TECHNICAL ANALYSIS
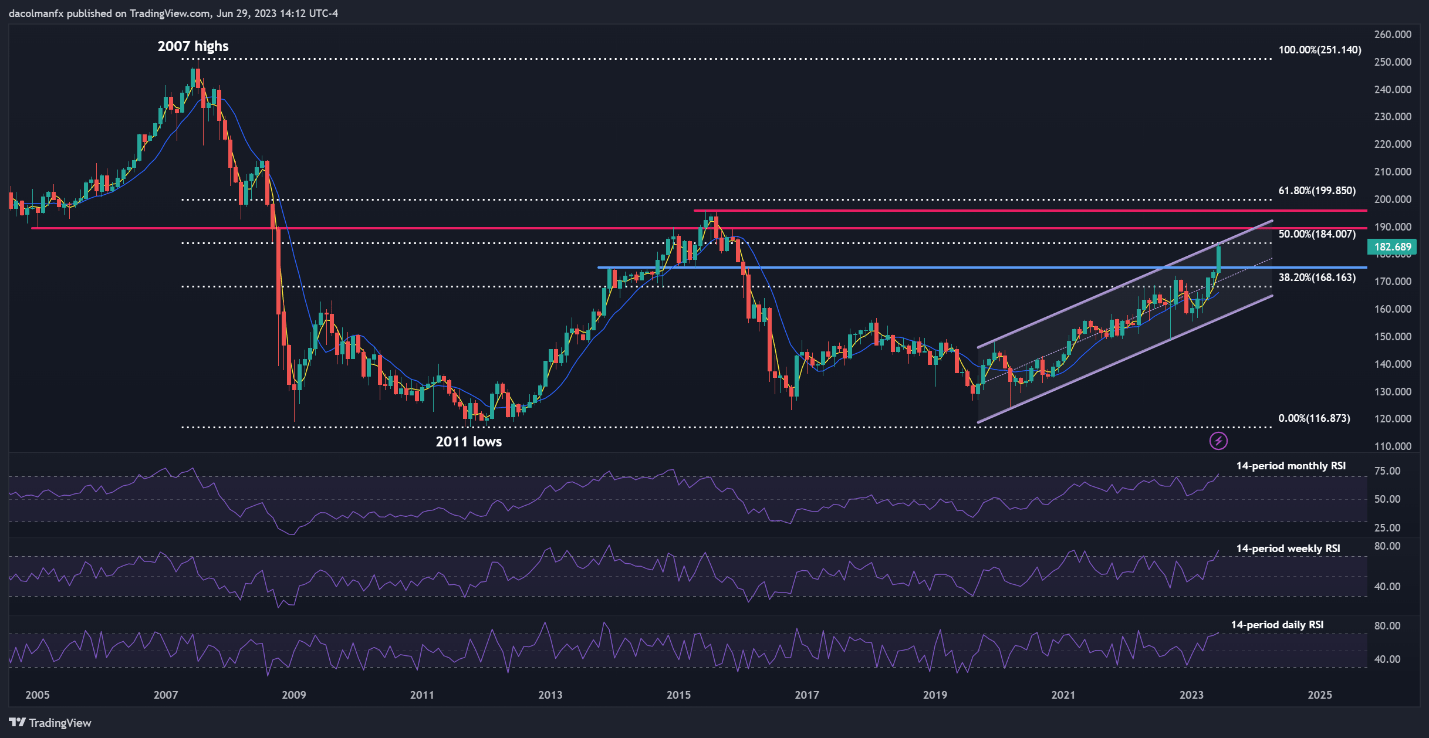
The British pound has strengthened aggressively against the Japanese yen in recent weeks, driven by the same dynamic that has benefited some G-10 currencies: rising yields at home. Focusing on performance, GBP/JPY is up nearly 5.5% in June, trading at its best levels since December 2015.
While sterling is entrenched in an undisputable uptrend, caution is warranted for a couple of reasons: 1) GBP/JPY is overbought according to the monthly, weekly, and daily RSI indicator, and 2) the pair is approaching resistance at 184.00, where the upper boundary of a long-term channel aligns with the 50% Fib retracement of the 2007/2011 selloff.
For technical guidance on direction, it is important to watch how prices behave and react around the psychological 184.00 mark in the coming days and weeks. That said, if prices break above this barrier decisively, buying impetus could gather pace, paving the way for a rally toward 190.00.
Conversely, if the pair is rejected from current levels and begins to decline, sellers could regain the upper hand, opening the door for a return to 175.50 in the medium term. This analysis was performed on the monthly chart, so any scenario discussed will not unfold overnight.
GBP/JPY TECHNICAL CHART