
GOLD/SILVER OUTLOOK & ANALYSIS
- Weaker US labor data and safe haven demand bolster gold prices.
- All eyes turn to Fed Chair Jerome Powell and Michigan consumer sentiment.
- XAG/USD looks to extend gains as XAU/USD could see some drawback.
Elevate your trading skills and gain a competitive edge. Get your hands on the Gold Q4 outlook today for exclusive insights into key market catalysts that should be on every trader's radar.

XAU/USD & XAG/USD FUNDAMENTAL BACKDROP
Gold prices exploited the weaker than expected Non-Farm Payrolls (NFP) report last week Friday that showed a higher unemployment rate and lower wage growth (a key contributor to inflationary pressures in the US). Although one release does not make a trend, this may be the beginning of a weaker jobs market within the region. The Federal Reserve would welcome such data in an environment where tight monetary policy conditions have heightened recessionary and stagflation concerns of recent. The known-on effect on financial markets saw a drastic decline in US Treasury yields, thus translating through to a fall in real yields (see graphic below). Overall, gold’s attractiveness has increased considering the opportunity cost of holding gold has decreased.
US REAL YIELDS (10-YEAR)
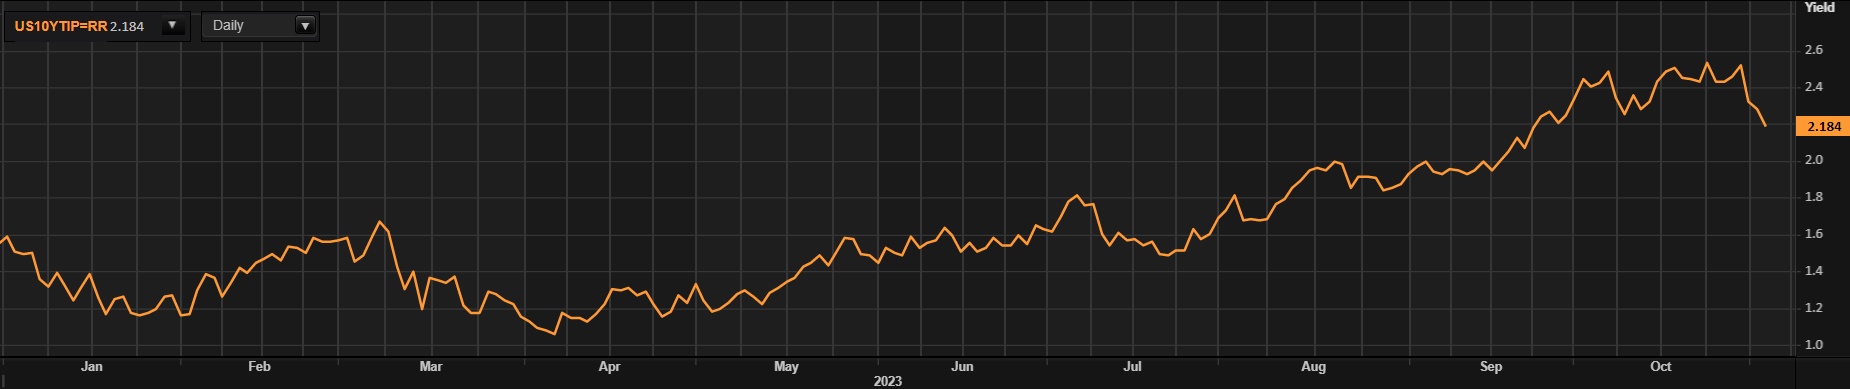
Source: Refinitiv
Money markets have shifted their interest rate expectations for the Fed by roughly 90bps from just a few weeks ago in terms of cumulative rate hikes by December 2024 (152bps) with the first cut projected around May/June as opposed to July.
IMPLIED FED FUNDS FUTURES
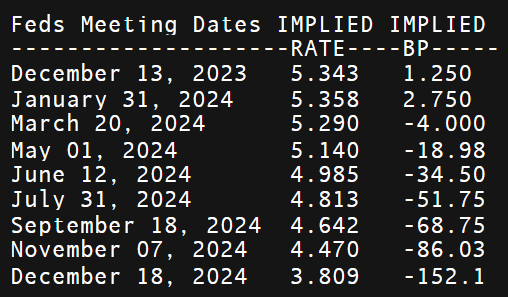
Source: Refinitiv
From a geopolitical standpoint, the war between Israel-Hamas remains volatile and will continue to support gold prices due to its safe haven allure. While the war is relatively contained at this point, any escalation could stoke contagion fears, ultimately driving up the price of gold.
The week ahead (see economic calendar below) is relatively muted versus last week but Fed guidance will drive volatility throughout the week. With Fed Chair Jerome Powell in focus, other Fed officials are scheduled to speak as well. Capping off the quiet week will see Michigan consumer sentiment possibly aiding the US dollar if expectations are to prove true.
GOLD ECONOMIC CALENDAR

Source: DailyFX
Want to stay updated with the most relevant trading information? Sign up for our bi-weekly newsletter and keep abreast of the latest market moving events!
Trade Smarter - Sign up for the DailyFX Newsletter
Receive timely and compelling market commentary from the DailyFX team
TECHNICAL ANALYSIS
GOLD/SILVER RATIO DAILY CHART
Chart prepared by Warren Venketas, TradingView
The gold/silver ratio price chart shows a developing ascending triangle pattern that could favor a further increase in the ratio reading. With gold and silver possibly staying elevated throughout the medium-term, gold may be the favorable metal.
MORE ON THE GOLD/SILVER RATIO HERE!
GOLD PRICE DAILY CHART
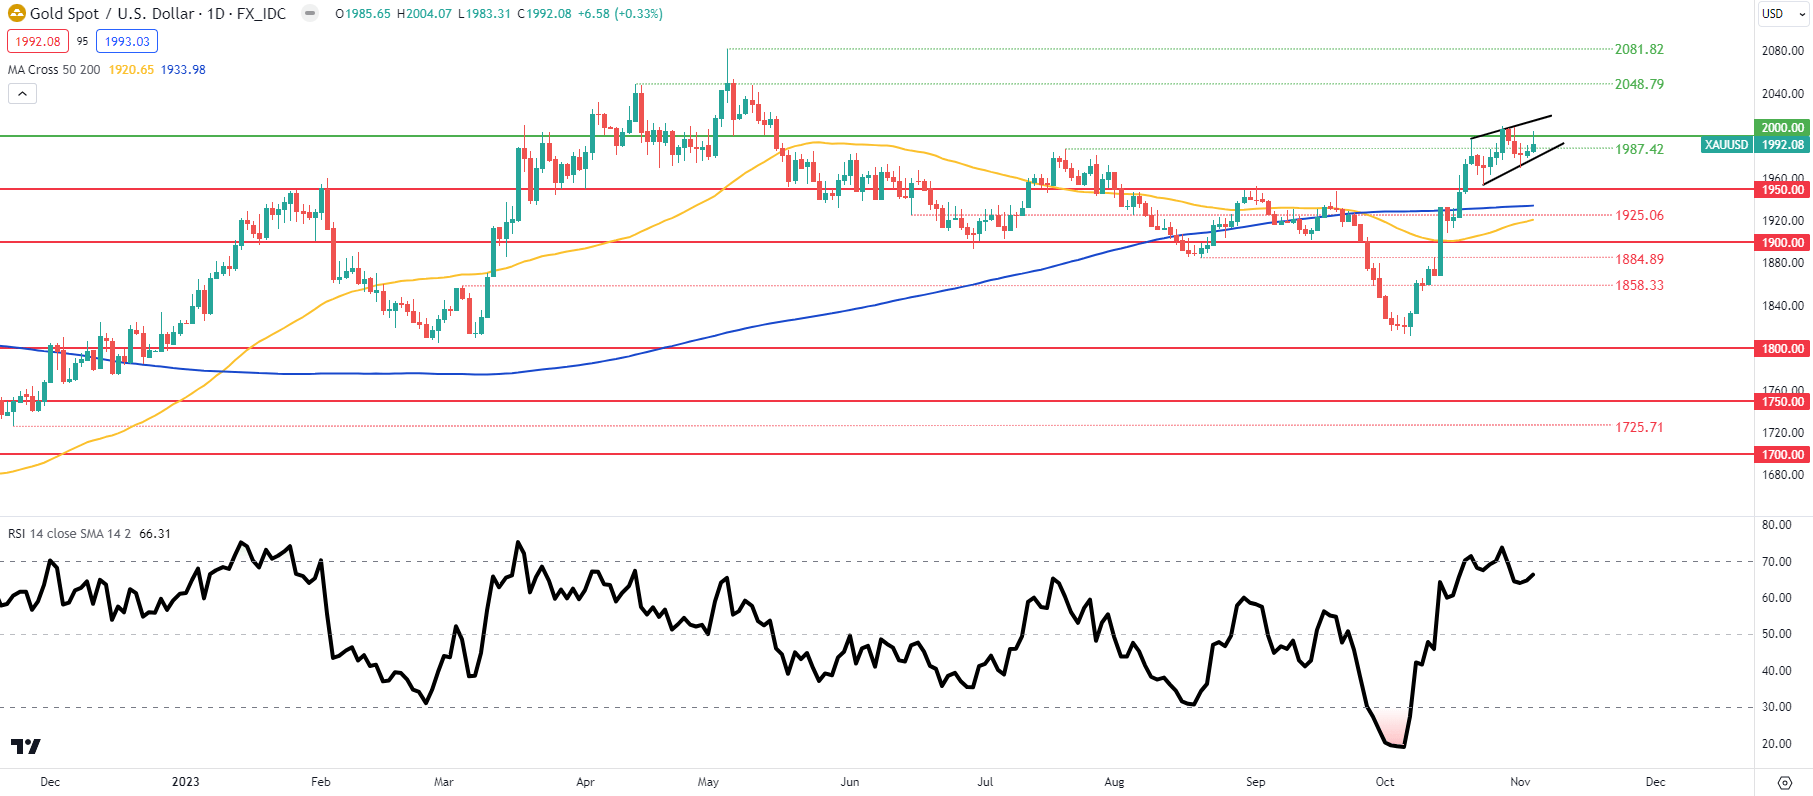
Chart prepared by Warren Venketas, TradingView
Daily XAU/USD price action currently trades within a rising wedge type formation (black) that traditionally appears after a prior downtrend. In this case, the uptrend negates much of the patterns validity but with the Relative Strength Index (RSI) in overbought territory, a pullback may not be out of the questions. A longer-term view could see gold price pair back after which a potential golden cross could form, allowing for another leg higher for XAU/USD.
Resistance levels:
- 2048.79
- 2000.00
- 1987.42
Support levels:
- Wedge support
- 1950.00
SILVER PRICE DAILY CHART

Chart prepared by Warren Venketas, TradingView
Silver prices are exhibiting a continuation pattern known as the bull pennant (black). Bulls will be looking for a breakout and confirmation close above pennant resistance/200-day moving average (blue) while a close below support could invalidate the upside move.
Resistance levels:
- 25.000
- 24.521
- 23.768
- Pennant resistance/200-day MA
Support levels:
- 50-day MA
- Pennant support
- 23.376
- 22.117
GOLD & SILVER IG CLIENT SENTIMENT: BULLISH
Curious to learn how market positioning can affect asset prices? Our sentiment guide holds the insights—download it now!
Introduction to Technical Analysis
Market Sentiment
Recommended by Warren Venketas
Contact and followWarrenon Twitter:@WVenketas