


Crude Oil Price, Charts and Analysis:
- Crude oil prices edge higher but remain in the doldrums.
- Saudi Arabia has reportedly extended its production cuts, Russia says it will reduce exports.
- However, tightening global monetary policy puts end-demand in serious doubt.

READ MORE: What is OPEC and What is Their Role in Global Markets?
Crude Oil prices rose very slightly in Tuesday’s trading but remain burdened by an unconstructive backdrop of plentiful supply meeting ever-more questionable demand.
Key export titan Saudi Arabia announced on Monday that its one-million-barrel daily production cut will be extended for another month, taking it through to August. It said that further extensions are possible. Meanwhile Russia said it would slash exports by 500,000 barrels per day in August.
Both countries are members of the’ Organisation of Petroleum Exporting Countries Plus’ grouping which has been reducing supply in an effort to support prices since last year. Even though overall OPEC Production was revealed to have been broadly steady last month, news of reductions from two such important players might usually be expected to offer prices more support.
However, the demand side still looks atrocious for the global oil market. This week’s key economic data from manufacturing sectors around the world has been disappointing from China, through Europe and on to the United States. With central banks almost everywhere raising interest rates to fight what’s now worryingly stubborn inflation, reduced economic activity is now effectively a monetary policy aim. This hardly bodes well for end-user energy needs, even as major oil producer's trim supply.
Of course, oil prices often move sideways in the Northern Hemisphere summer as less energy is required for heating and lighting purposes, but it’s not exactly tough to spot a deeper malaise at work this year as prices languish between $70 and $80. International benchmark Brent crude has now seen four consecutive quarters of losses, with the US West Texas Intermediate bellwether fairing little better.

US Crude Oil Technical Analysis
WTI Crude Oil Daily Chart
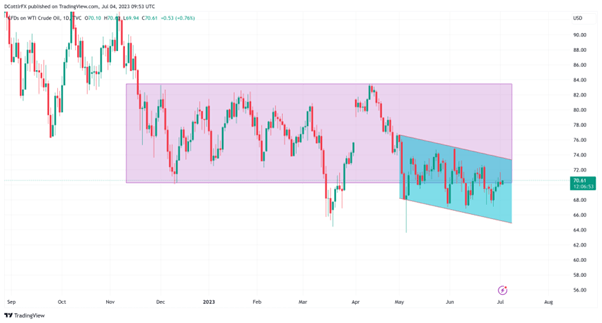
Chart Compiled Using TradingView
Prices are clearly within a broad downtrend channel, but bulls can perhaps take heart from two factors. Firstly, while there’s been a precession of lower highs since early May, themselves an extension from the fall from April’s near-term peak, the market has so far declined to match these with lower lows.
The second crumb of good bullish news is that the $70.17 region remains in play. This was the intraday low from December 13 and, ever since, the market has managed to recapture it in short order whenever it has given way. This is quite interesting because the level doesn’t at face value seem to offer much in the way of important support. But it has been retaken very quickly on five occasions since mid-March and its fate bears watching.
Support in the $67.24-67.90 region has held bearish forays lower since May and it will be interesting to see if it can do so again should that area be tested in the coming days. If it can’t, there’s likely downward-channel support at $65.23, but that is a long way below the current market given the size of recent daily ranges.Bulls will probably need to durably retake June 21’s intraday top of $72.59 if they’re going to make meaningful progress in what looks like a rather rangebound market, in need of its next cue.
There isn’t much between current levels and the lows of March 21, below $66. And those were the weakest levels seen since way back in December 2021.
IG’s own sentiment data looks quite bullish for US crude, with 71% of traders coming at it from the long side at current levels. This may even suggest that the optimism is a little overdone for a bounce-back, however.
Trade Smarter - Sign up for the DailyFX Newsletter
Receive timely and compelling market commentary from the DailyFX team
--By David Cottle for DailyFX


