


CANADIAN DOLLAR PRICE, CHARTS AND ANALYSIS:
- The Loonie Looks on Course for Further Gains This Week as the Bank of Canada (BoC) is Expected to Hike Rates in July.
- BoC Summary of Projections Revealed the Concerns Around Price Pressures and the Labor Market.
- Inflation and GDP Data Due this Week Could Keep CAD Bulls on the Front Foot.
- To Learn More About Price Action, Chart Patterns and Moving Averages, Check out the DailyFX Education Section.
Trade Smarter - Sign up for the DailyFX Newsletter
Receive timely and compelling market commentary from the DailyFX team
Read More: EUR/USD Price Forecast: EUR/USD Looks to ECB Forum for Guidance
CANADIAN DOLLAR BACKDROP
It has been an interesting couple of weeks for the Canadian Dollar as the loonie has had an impressive run against the Greenback in particular. This has come against a backdrop of falling Oil prices, which is a surprise given the correlation between the two.
Over the past couple of weeks attention has been on other Major Central Banks and their rate paths for the rest of 2023, allowing the Bank of Canada (BoC) to slide under the radar. Last week did bring the Bank’s Summary of Deliberations from the June meeting which confirmed that robust debates took place regarding the rate hike witnessed in June while also signaling a potential hike in July. The Central Bank stated it was surprised by the strength of the economy with household consumption remaining strong with underlying price pressure still evident across large swathes of the economy.
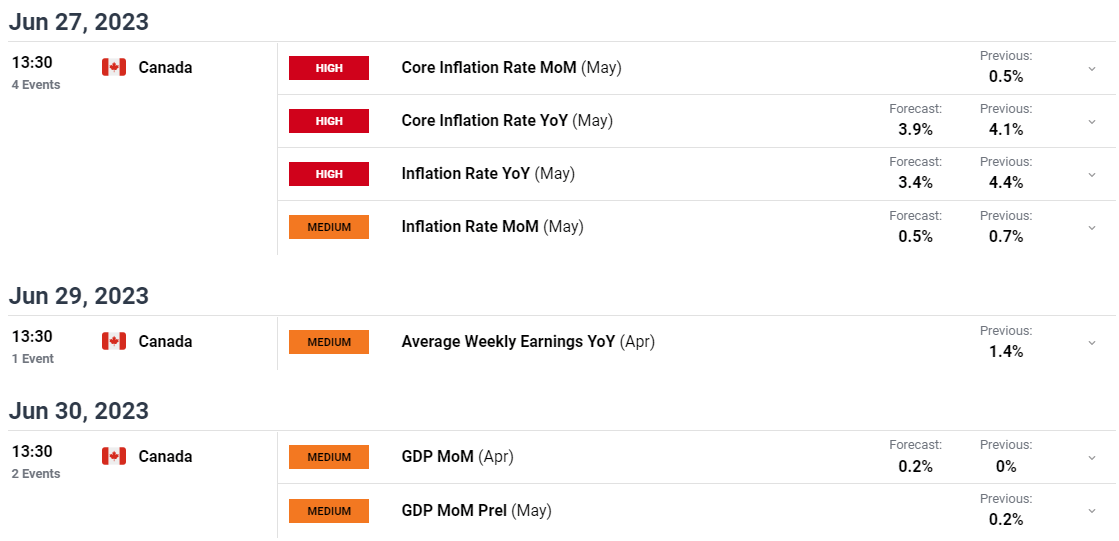
Market participants are pricing in a further 25bps hike in July with this week’s data from Canada likely to prove a key gauge. Tomorrow brings the inflation data for May which will no doubt be viewed with particular interest in light of persistent price pressures experienced in other developed economies, the UK being the most notable. The Average Weekly Earnings data may provide another clue as to the inflationary pressure evident in the labor market while we round of the week with preliminary Canadian GDP for the month of May. Increases in the inflation and weekly earnings print could lend further support to the loonie as rate hike expectations are likely to face hawkish repricing as a result. A lot to digest and unpack for the Canadian Dollar as Q3 approaches.
For all market-moving economic releases and events, see the DailyFX Calendar
Introduction to Technical Analysis
Learn Technical Analysis
Recommended by Zain Vawda
PRICE ACTION AND POTENTIAL SETUPS
USDCAD
USD/CAD Daily Chart
Source: TradingView, prepared by Zain Vawda
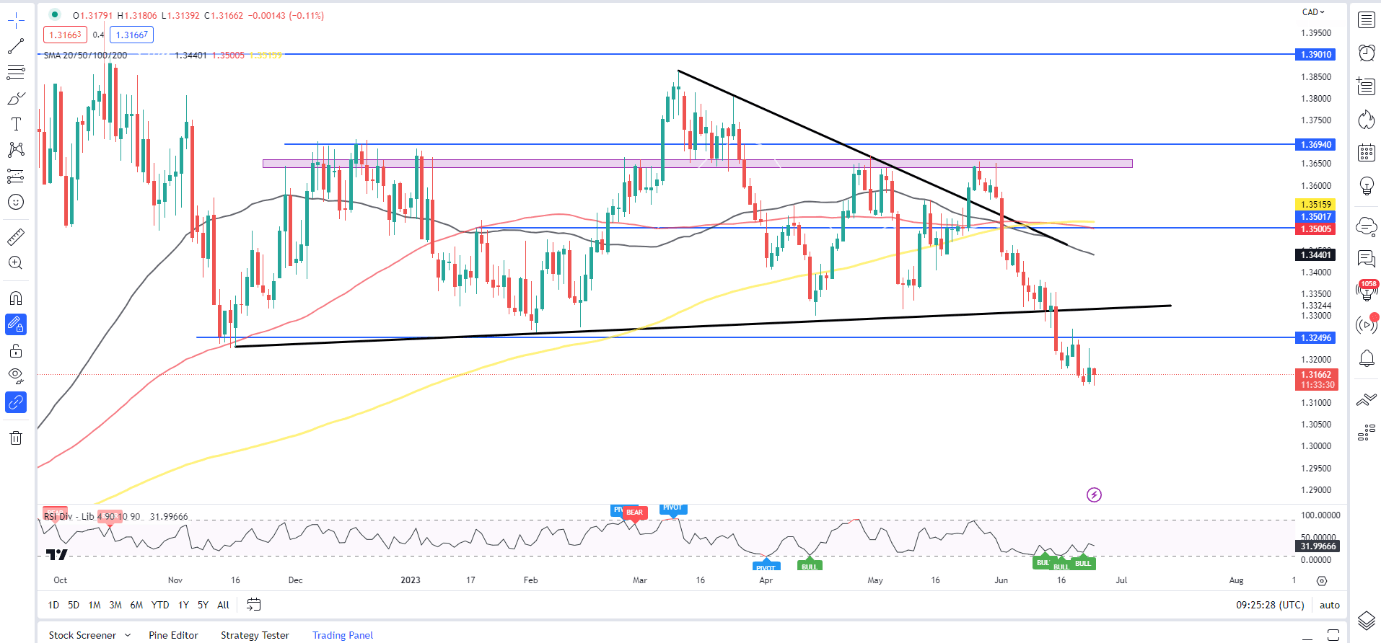
USDCAD has continued to grind lower this morning following Friday’s attempt at a recovery. The daily candle did close as an inverted hammer hinting at the potential for some bullish momentum today which has thus far failed to materialize.
The possibility of a bullish bounce here before downside continuation resumes remains in play with immediate resistance resting around the 1.3250 handle before the ascending trendline break may finally get a retest around the 1.3320 handle.
Alternatively, a continuation of the downside momentum from current price levels brings support at the psychological 1.3000 level into play with a break lower opening up a potential retest of the August 2022 lows around the 1.2750 handle.
Key Levels to Keep an Eye On:
Support levels:
- 1.3000
- 1.2900
- 1.2750 (August 2022 Swing Low)
Resistance levels:
- 1.3250
- 1.3320
- 1.3440 (50-day MA)
GBPCAD
GBP/CAD Daily Chart
Source: TradingView, prepared by Zain Vawda
From a technical perspective, GBPCAD has been interesting of late. The GBP has enjoyed a stellar rally of late, a lot of which has been negated by the strength of the loonie before some losses to end last week.
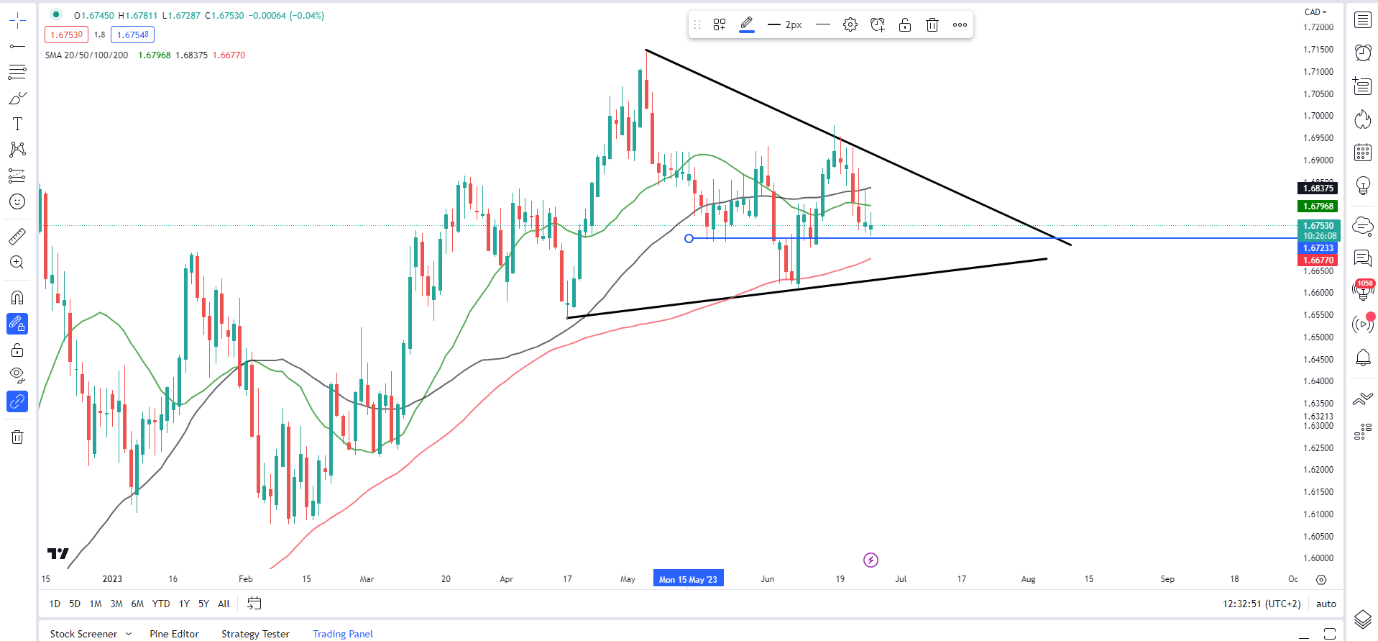
Looking at price action and we do appear to be printing higher highs and higher lows since bottoming out on June 8. Friday’s daily candle closed as an inverted hammer with price action today remaining mixed thus far.
A daily candle close above the 1.6720 area could see a new high being made and a potential break out of the triangle pattern in play at the moment. Immediate resistance may prove a sticking point however, with the 20 and 50-day MAs resting at 1.6797 and 1.6840 respectively. Alternatively, a break to the downside would first require a daily candlestick close below the 1.6720 handle before the 100-day MA comes into focus and then a potential downside break of the triangle pattern. A breakout in either direction has the potential to result in a 600-pip rally.
Key Intraday Levels to Keep an Eye On:
Support levels:
- 1.6720
- 1.6670 (100-day MA)
- 1.6540
Resistance levels:
- 140.00
- 141.00
- 142.13
CADJPY
CAD/JPY Daily Chart
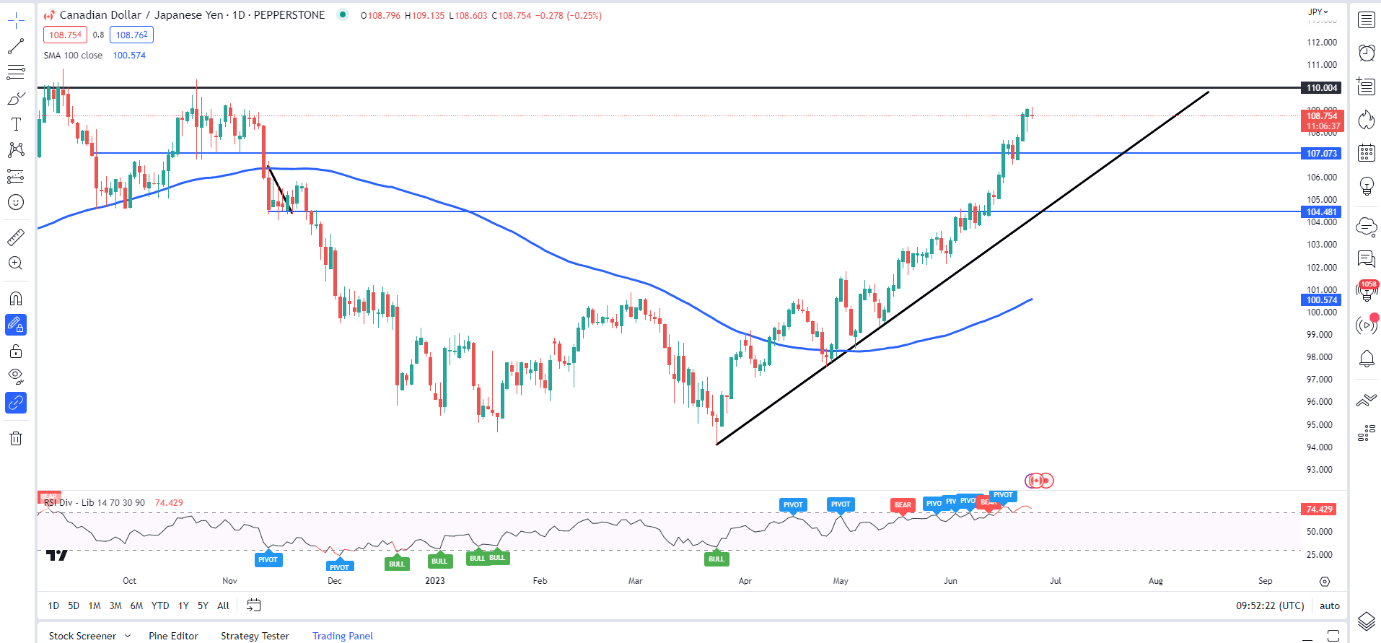
Source: TradingView, prepared by Zain Vawda
Much like Japanese Yen pairs across the board the Canadian Dollar has enjoyed significant gains of late, with the pair now trading at levels last seen in October 2022. The Canadian Dollar has extended its winning streak to 6 consecutive weeks against the Yen as the lack of any policy pivot by the Bank of Japan (BoJ) continues to weigh on the currency.
Just this morning we heard comments from Japan's Chief Cabinet Secretary Matsuno who confirmed they are monitoring the FX markets closely as there have been sudden and one-sided moves in the FX market. The comments have resulted in some Yen appreciation since but is likely to be short lived at this stage.
Looking at the weekly chart and the 14-day RSI is hovering around overbought territory with the daily timeframe telling a similar story. Not surprising given 6-weeks of consecutive gains however whether the Yen will be able to hold onto gains and push CADJPY lower remains up for debate.
Key Levels to Keep an Eye On:
Support levels:
- 108.00
- 106.75
- 105.35
Resistance levels:
- 110.00 (Psychological Level)
- 110.85
- 112.00
Introduction to Technical Analysis
Relative Strength Index (RSI)
Recommended by Zain Vawda
--- Written by Zain Vawda for DailyFX.com
Contact and follow Zain on Twitter: @zvawda


