


FOMC Post Event Analysis
- Fed keeps rate hike on the table as insurance during a dovish meeting
- A bearish USD and hopes of a major policy pivot in Japan highlight USD/JPY
- US stocks hardly require a reason to rally but got one anyway
- The analysis in this article makes use of chart patterns and key support and resistance levels. For more information visit our comprehensive education library
Fed Keeps Rate Hike on the Table as Insurance During a Dovish Meeting
Jerome Powell spent the majority of the press conference talking about progress being made on the inflation front, the likelihood we have reached peak interest rates and an economy that is likely to ease in 2024 alongside the labour market.
The Fed Chairman also admitted that the topic of interest rate cuts is coming into view which is as close as you’re likely to get to an admission that the committee believes it has done enough as far as the tightening cycle is concerned.
The updated summary of economic projections revealed an anticipated 75 basis points worth of cuts next year, which only emboldened the Fed funds futures market to price in 150 basis points in cuts for 2024 – weighing on the US dollar. Inflation forecasts were also revised lower in light of recent progress on more sticky measures of inflation like services inflation ex-housing and core measures of inflation.
Economic growth was revised substantially higher for 2023 to account for the phenomenal performance in Q3, while question marks remain around Q4 which is expected to moderate to a more sustainable level.
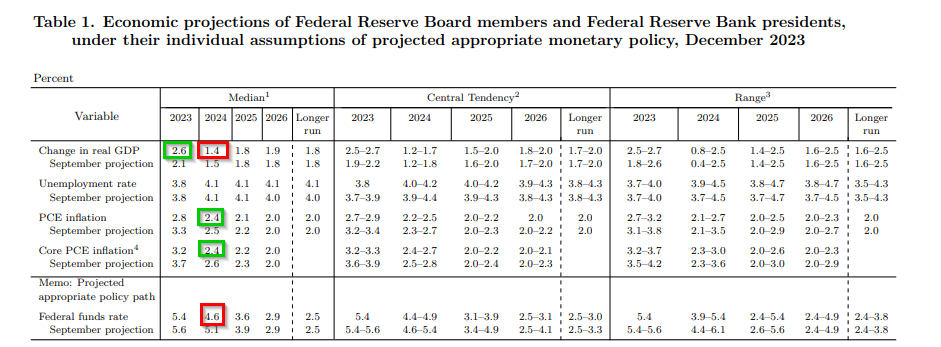
Source: US Federal Reserve Bank, prepared by Richard Snow
USD Extends Bearish Trend – Trading Below Key Marker
The US dollar surrendered recent gains in the wake of the FOMC statement and subsequent press conference as did bond yields. With the prospect of another rate hike fading away, the greenback continues to sell-off, even this morning.
DXY dropped below the 200-day simple moving average (SMA), taking out the key 103.00 level in the process.
Daily Chart: US Dollar Basket (DXY)
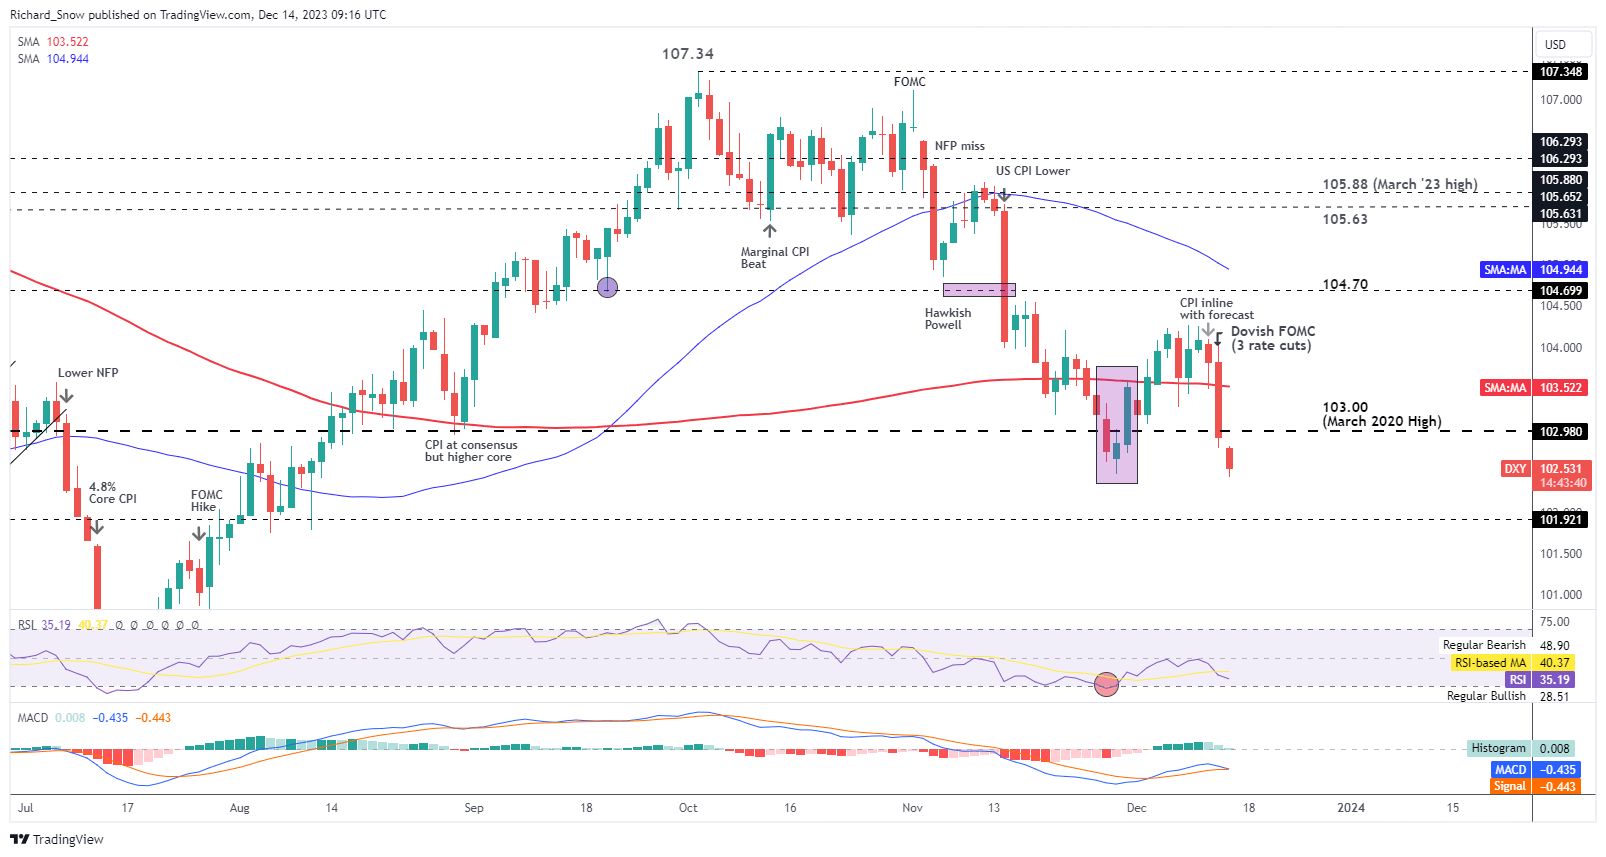
Source: TradingView, prepared by Richard Snow
Are you new to FX trading? The team at DailyFX has curated a collection of guides to help you understand the key fundamentals of the FX market to accelerate your learning :


US bond yields were also weaker, having a ripple effect in other major economies where sovereign yields moved lower too. The 10- year yield has shed an entire percentage point since the late October peak when inflation data had managed to surprise to the upside to keep chances of that final rate hike alive.
US 10-Year Treasury Yields
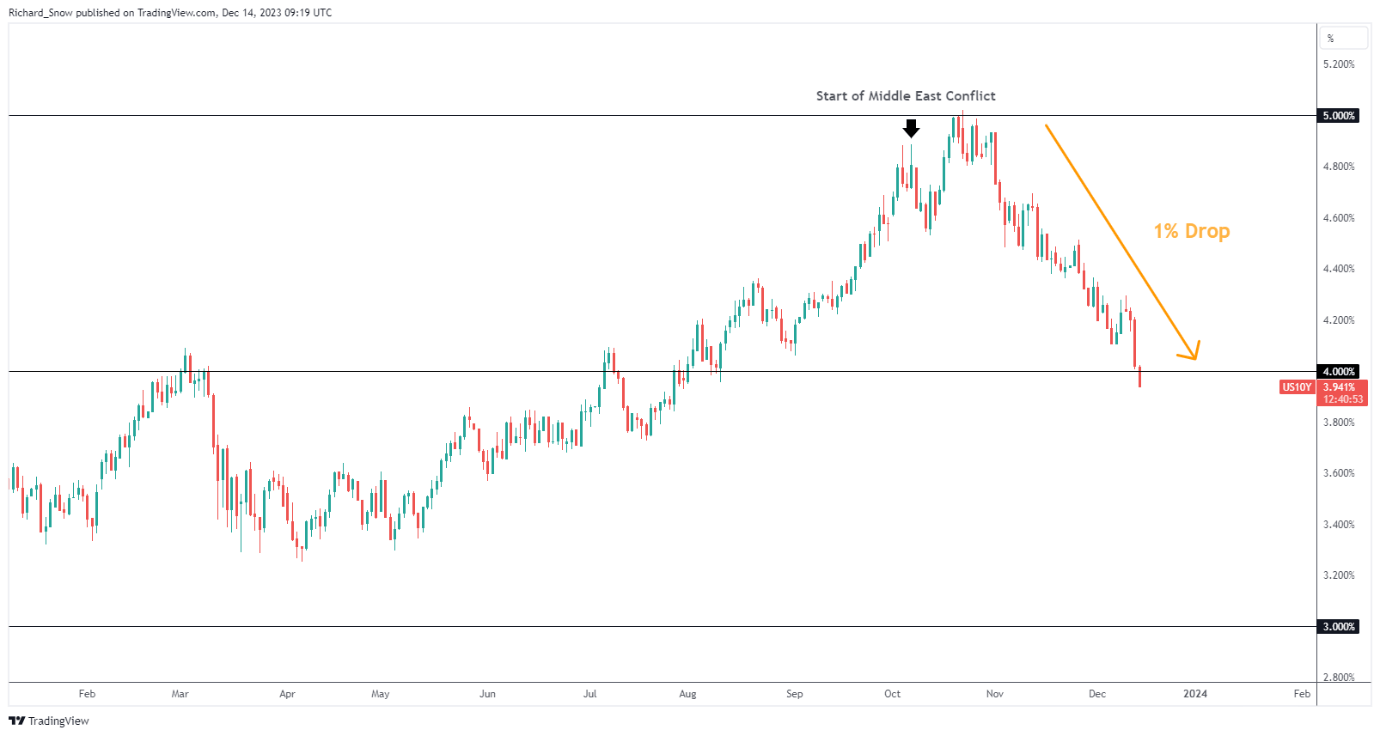
Source: TradingView, prepared by Richard Snow
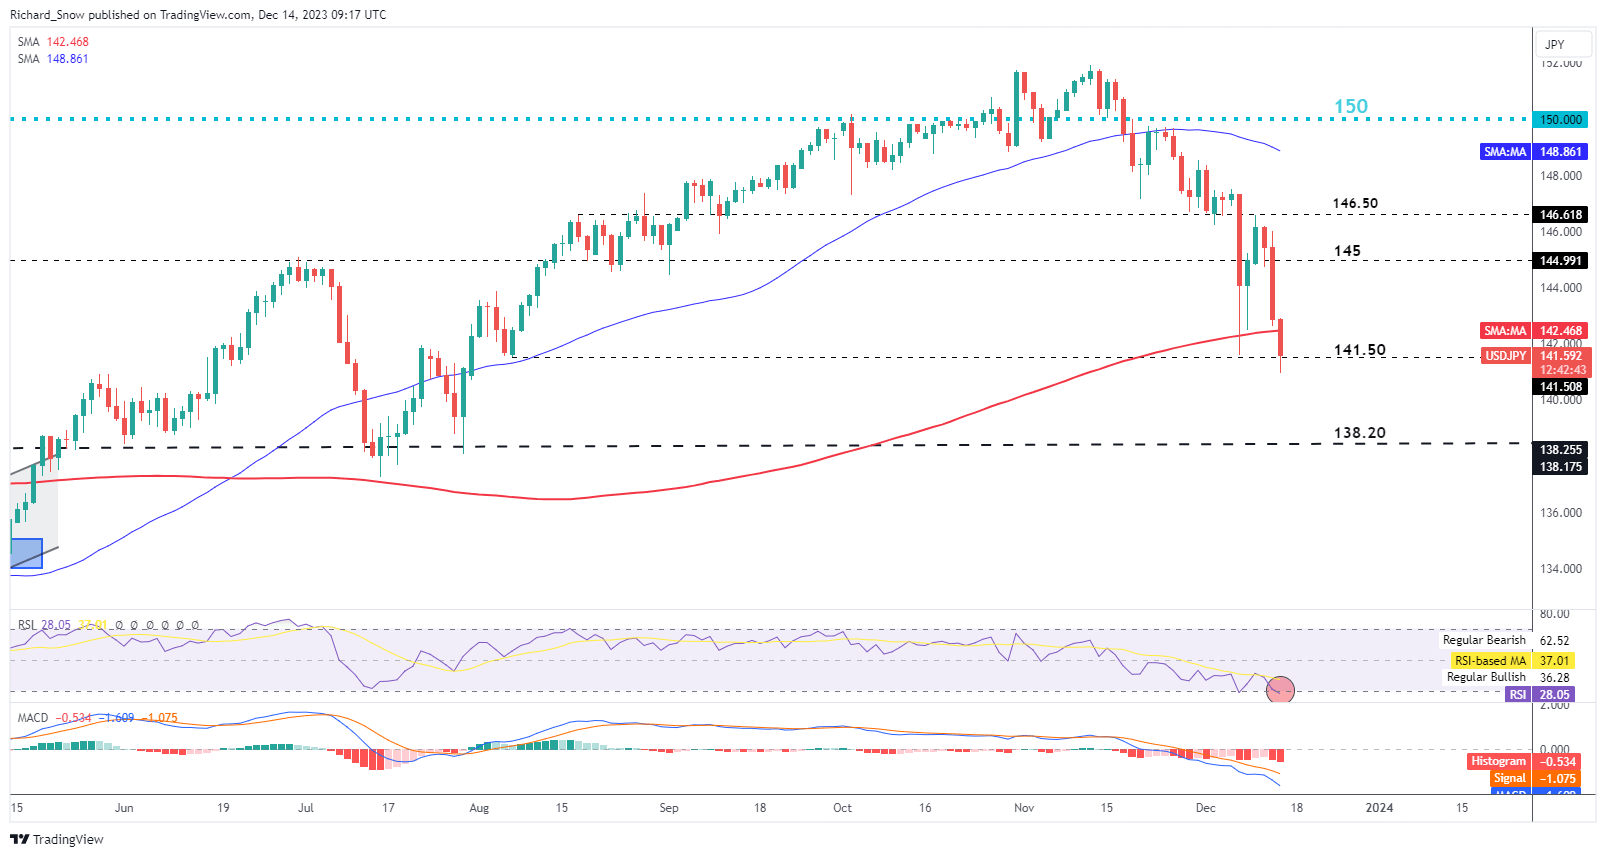
A Bearish USD and Hopes of a Major Policy Pivot in Japan Highlight USD/JPY
It is no surprise to see the USD/JPY bear trend accelerate after the FOMC announcement. Traders have been adding to bets that the Bank of Japan (BoJ) is nearing a historic shift in its ultra-loose monetary policy framework which has wide ranging ramifications for global markets as the carry trade is under threat.
At a time when rate expectations in the US are on the decline, Japan is potentially looking to raise rates in the first half of next year if the decision-making body is convinced of consistently high inflation with wage growth to match.
The weaker dollar combined with anticipated yen appreciation means that USD/JPY is shaping up to be a crucial FX pair into year end and particularly for 2024. The pair erased all recent gains stopping short of the 200 SMA but this morning managed to conquer it. The current level of support is at 141.50, followed by 138.20 – a notable level of support in June and July as well as providing a pivot point (as resistance) in March. Dynamic resistance appears at the 200 SMA in the event of a pullback.
USD/JPY Daily Chart
Source: TradingView, prepared by Richard Snow
| Change in | Longs | Shorts | OI |
| Daily | -6% | -3% | -3% |
| Weekly | 7% | 3% | 3% |
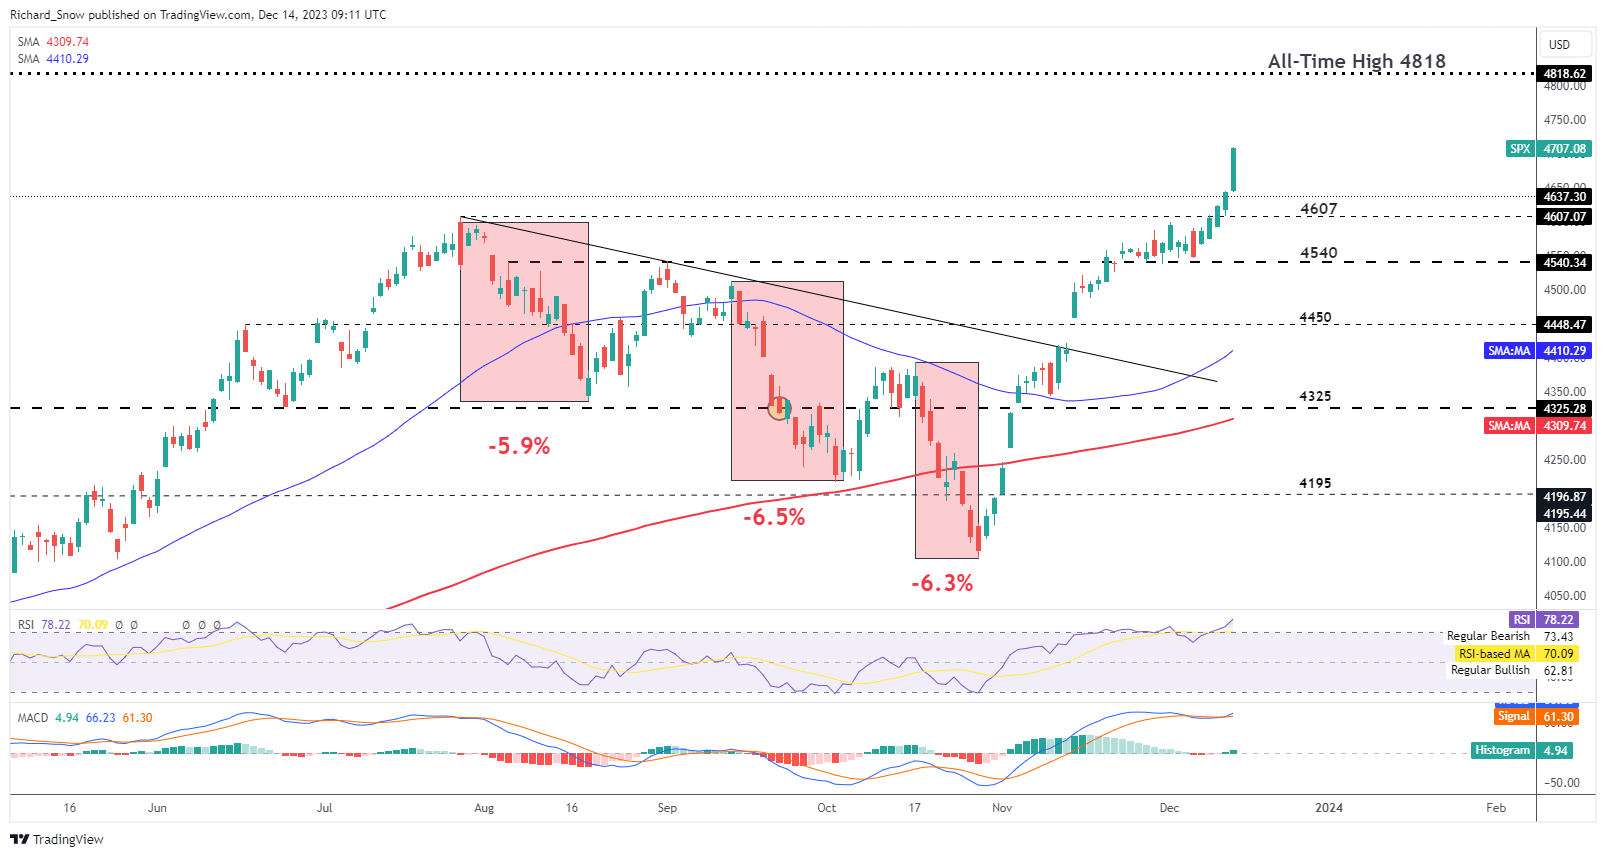
US Stocks Hardly Require a Reason to Rally but Got one Anyway
US equities soared higher in the aftermath of the FOMC event despite trading well into overbought territory. US Indices have completed an impressive recovery, reclaiming lost ground since the August decline and then extending even higher to mark a new yearly high.
The S&P 500 is 2.3% off the all-time high and with interest rate cuts firmly in view, it is likely we get there. Google’s launch of its rival to Chat-GPT, Gemini, has reignited the AI hype train to add to bullish factors in favour of further gains in the tech heavy index.
4818 is the next level of resistance but the big question around any let off in the bullish run remains unanswered. It would be a monumental effort to print an all-time high without taking a breather from here and so 4607 is the mark to look out for is we are to see the index taking a breather before the next advance. However, current momentum is yet to show a conclusive momentum shift, meaning further gains from such extended levels remain a possibility.
S&P 500 Daily Chart
Source: TradingView, prepared by Richard Snow
Trade Smarter - Sign up for the DailyFX Newsletter
Receive timely and compelling market commentary from the DailyFX team
--- Written by Richard Snow for DailyFX.com
Contact and follow Richard on Twitter: @RichardSnowFX


