


Euro Price Setups: EUR/USD, EUR/GBP, EUR/JPY
- EU PMI data shows modest improvement but demand hampers growth
- EUR/USD: Treasury yields outpace Bund yields, ECB more likely to have peaked
- EUR/GBP: Mean reversion in focus as bullish potential fades
- EUR/JPY: FX intervention speculation stokes yen volatility
The new quarter brings new possibilities for the euro. Find out from DailyFX analysts what the euro has in store for Q4:

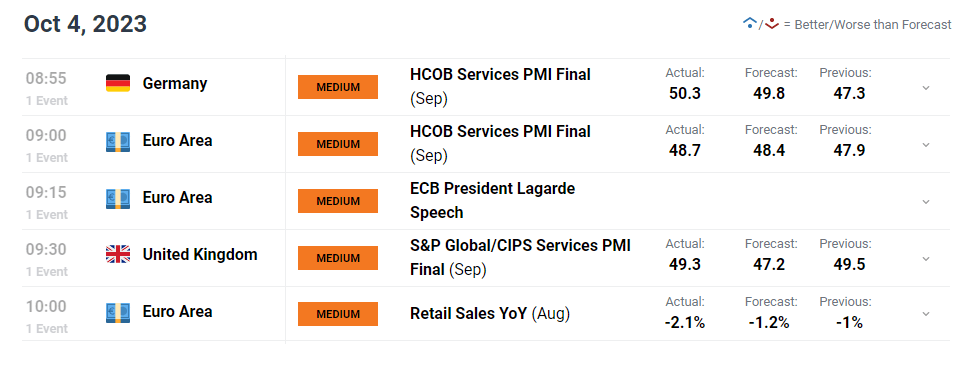
EU PMI Data Shows Modest Improvement but Demand Hampers Growth
PMI data witnessed marginal improvements across services and manufacturing but the overall outlook remains treacherous. The euro zone economy most likely endured a contraction in Q3 after the report showed the fastest drop off in demand over the past three years as elevated interest rates and higher prices squeeze consumers.
The 50 mark separates expansion from contraction with most measures remaining sub 50, except for the services industry in Germany which printed at 50.3. The Euro Area has experienced stagnant growth, seeing quarter on quarter GDP rising a mere 0.1% for each of the last two quarters.
Customize and filter live economic data via our DailyFX economic calendar
EUR/USD: Treasury Yields Outpace Bund Yields, ECB More Likely to Have Peaked
Us treasury yields have soared as the ‘higher for longer’ narrative gains traction as Fed officials open the door to another rate hike before year end. In contrast, markets anticipate that the ECB has likely reached a peak in interest rates, reducing bullish potential for the currency.
Treasury securities appear to be carrying a term ‘premium’ meaning bond holders demand greater compensation for assuming greater risk. These risks include rising deficit spending, the downgrade on US debt and the strain that higher interest rates impose on debt repayments.
The Federal Reserve Bank of New York has published its estimate of term premium which has turned positive as the same time we are seeing the notable rise in US bond yields:
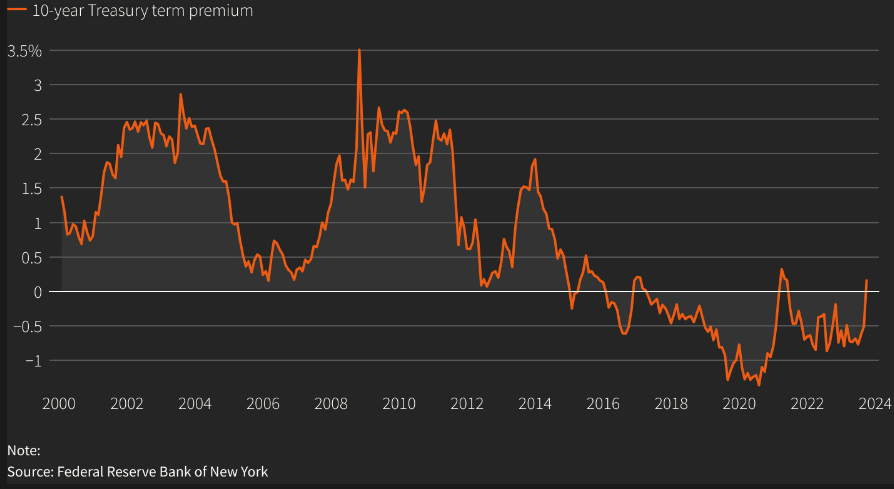
Source: Refinitiv, The Fed, prepared by Richard Snow
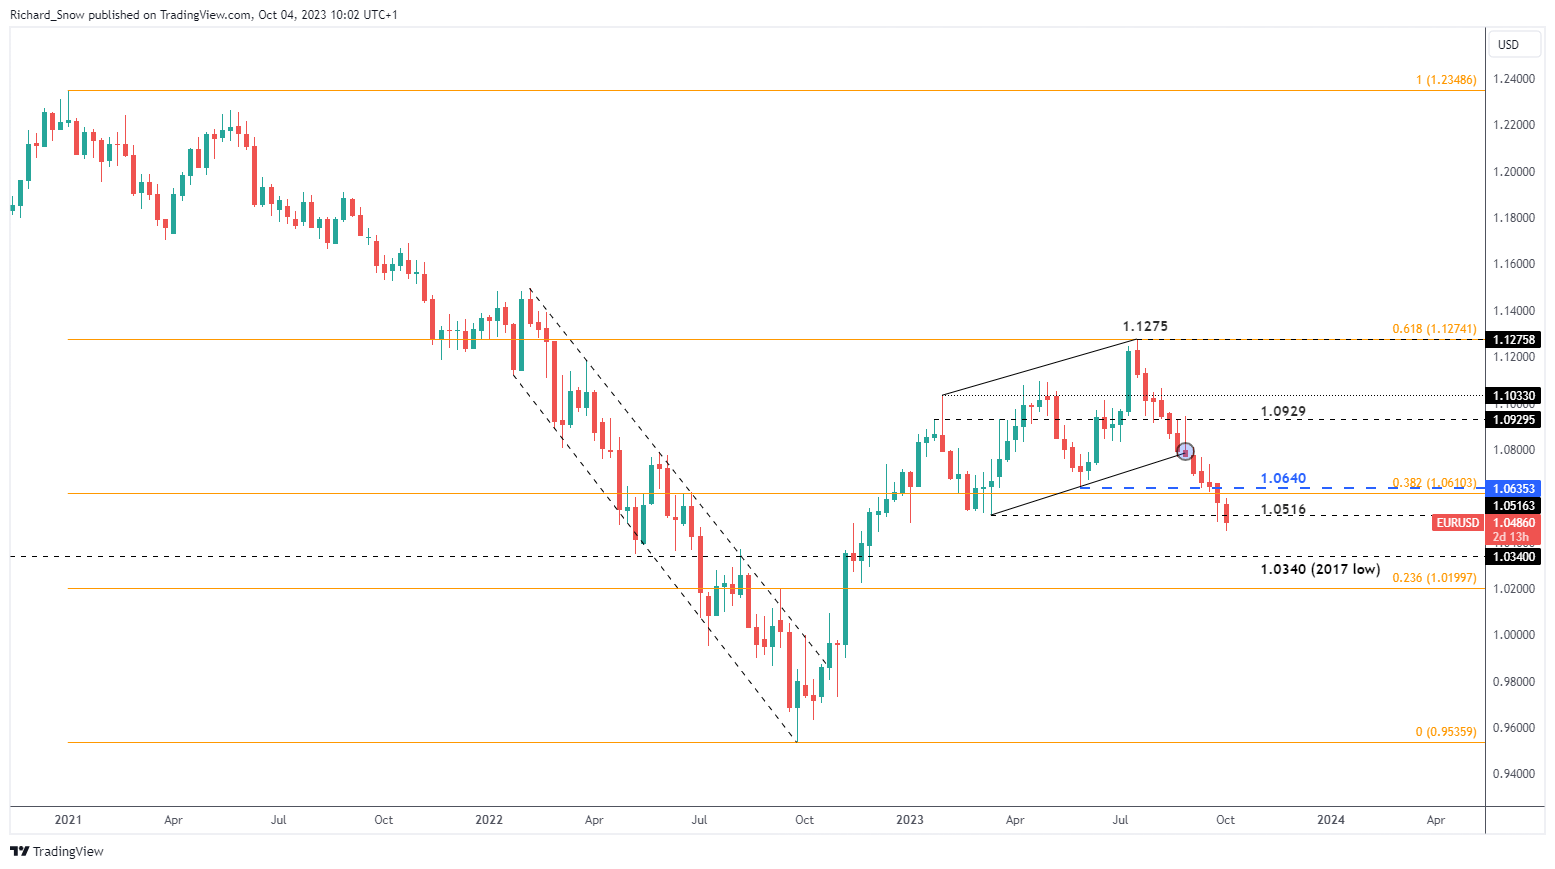
EUR/USD maintains the consistent downtrend, which has continued uninterrupted ever since breaking beneath the 200-day simple moving average (SMA). However, today’s price action reveals green shoots of a possible pullback, testing the prior zone of support that halted declines back in February and March this year. The RSI is in the process of moving away from oversold territory, while the MACD indicator reveals a consistent downtrend that may be due a correction.
The blue line shows the yield differential between Bunds and Treasuries (10-year Bund yield – 10-year Treasury yield). The trend is undeniable and exerts downward pressure on the pair as long as the discrepancy exists.
From a trader’s point of view, the trend is extremely mature and the possible sings of a pullback reduce the appeal of a trend following strategy at current levels. A more prudent approach may involve looking for opportunities to re-enter the trend at more favourable levels, after a slight correction/pullback.
EUR/USD Daily Chart

Source: TradingView, prepared by Richard Snow
The euro and the euro zone represent a unique economic arrangement that boasts one of the largest trading zones in the world. Find out the ins and outs of how to trade the world's most highly traded pair:

The weekly chart reinforces the downtrend, particularly after the conclusive breakdown of the prior ascending channel. Prices have dropped through prior levels of interest on the weekly chart with the significant, long-term level of 1.0340 posing the next level of support, followed by the 23.6% Fibonacci retracement of the major 2021-2022 decline.
EUR/USD Weekly Chart
Source: TradingView, prepared by Richard Snow
EUR/GBP: Mean Reversion in Focus as Bullish Potential Fades
EUR/GBP received a boost after UK inflation posted some encouraging data on the 20th of September. The better-than-expected figures resulted in markets lowering expectations of another hike, leaving sterling vulnerable to losses.
The reaction was immediate and saw the pair test the 200 SMA around 0.8700 before consolidating. Now, the 0.8660 zone separates the pair from trading back within the horizontal channel that had contained the majority of price movement in the second half of the year.
The extended upper candle wicks (yesterday and today thus far) suggest a reluctance to trade higher, as bears force the pair back down. 0.8635 appears as the tripwire for mean reversion and a move deeper into the channel once again. The potential for a MACD crossover provides additional interest in a return to the downside for the pair.
EUR/GBP Daily Chart

Source: TradingView, prepared by Richard Snow

EUR/JPY: Intervention Speculation Stokes Yen Volatility
Yesterday’s volatile move across Japanese Yen pairs caused a stir in the FX market after USD/JPY reached 150, a marker widely touted to be the level that currency officials will not tolerate. After touching 150 in USD/JPY, EUR/JPY dropped sharply but a large portion of the drop was recovered in the moments that followed – somewhat reminiscent of what happened in September last year.
A such, if the Ministry of Finance and BoJ co-operated to intervene in the FX market yesterday, we could still see a period of yen weakness despite their efforts, just like in September 2022 where prices rose a further 4% before the next round of intervention ensued.
Nevertheless, trading the yen is a very risky endeavor right now. It has the potential to produce volatile price swings even if the chosen outcome proves to be correct. Tokyo’s frequently communicated displeasure around the value of the yen acts to limit upside potential in the pair and the MACD shows a clear bias towards downward momentum.
The pair has also broken below the channel of consolidation, opening up the possibility of a sustained move to the downside upon any direct intervention that may still be to come. Something else to note is that Japanese officials have intervened after Asian markets have closed, affording them more bang for their buck during periods of reduced yen liquidity. Yesterday’s volatility event took place around 3pm in the London. While prices trade below the channel’s lower bound, 153.45 remains the next level of support and with the potential to move through 151.61 too.
EUR/JPY Daily Chart
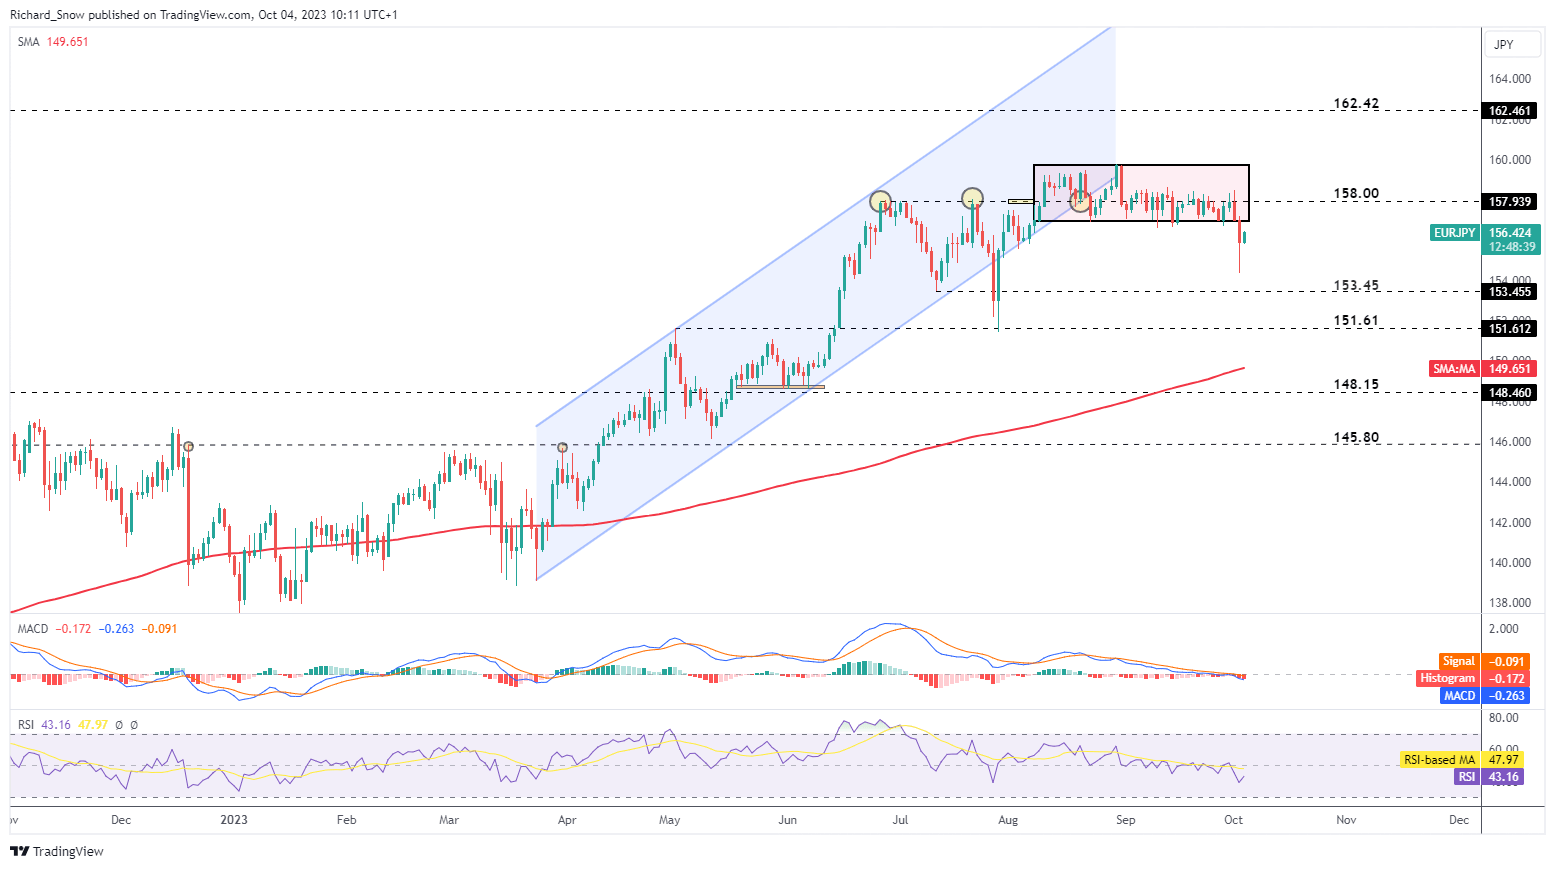
Source: TradingView, prepared by Richard Snow
Trade Smarter - Sign up for the DailyFX Newsletter
Receive timely and compelling market commentary from the DailyFX team
--- Written by Richard Snow for DailyFX.com
Contact and follow Richard on Twitter: @RichardSnowFX


