Article by IG Chief Market Analyst Chris Beauchamp
Dow Jones, Nasdaq 100, Nikkei 225 Analysis and Charts
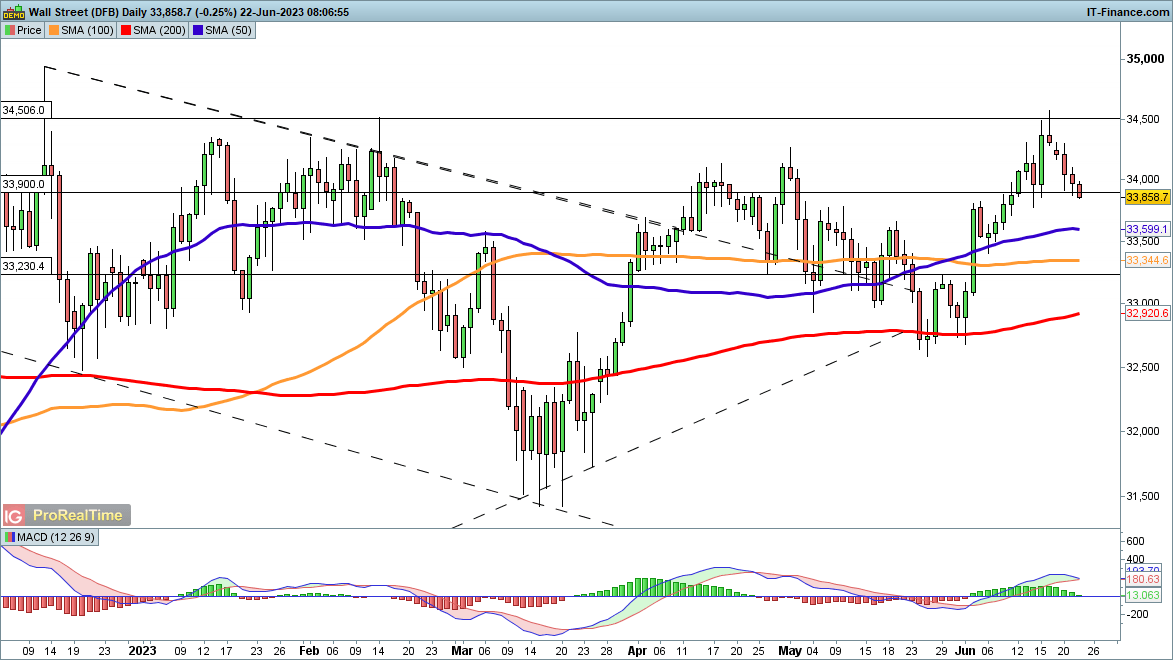
Dow touches one-week low
The index continues to retreat from the six-month high it hit last week, shedding ground rapidly in the direction of the 50-day SMA. The bullish view might still hold sway should the index be able to create a low above the 100-day SMA, though for the moment short-term momentum is firmly to the downside.
A rebound above 34,000 might yet see the bullish view revived and allow the index to contemplate a fresh attempt to move back towards the 34,500 level.
Trade Smarter - Sign up for the DailyFX Newsletter
Receive timely and compelling market commentary from the DailyFX team
Dow Jones Daily Price Chart - June 22, 2023
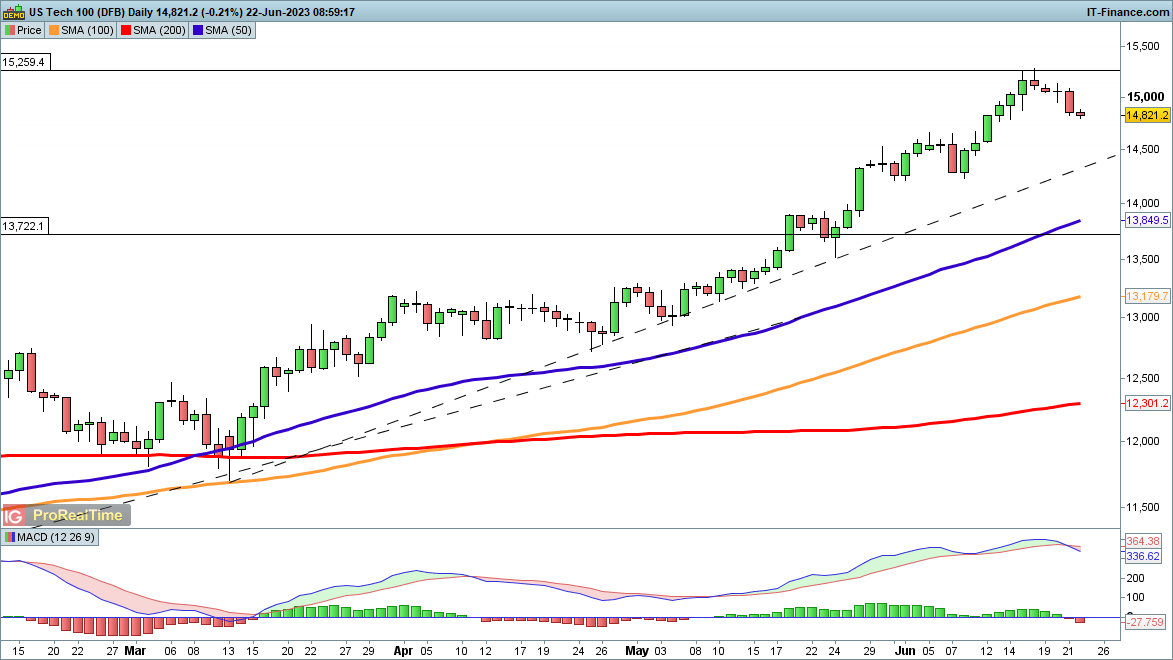
Nasdaq 100 drifting lower
The retreat from last week’s highs continues, although it will take much bigger losses to really put a dent in the downtrend.An initial target would be trendline support from March, likely to come into play around 14,500. Even this would only be a two-week low. Below this, the 50-day SMA is the next target.
For the moment there is little sign of a recovery, but a recovery above 15,000 would signal that the buyers are in charge once again.
Nasdaq 100 Daily Price Chart - June 22, 2023

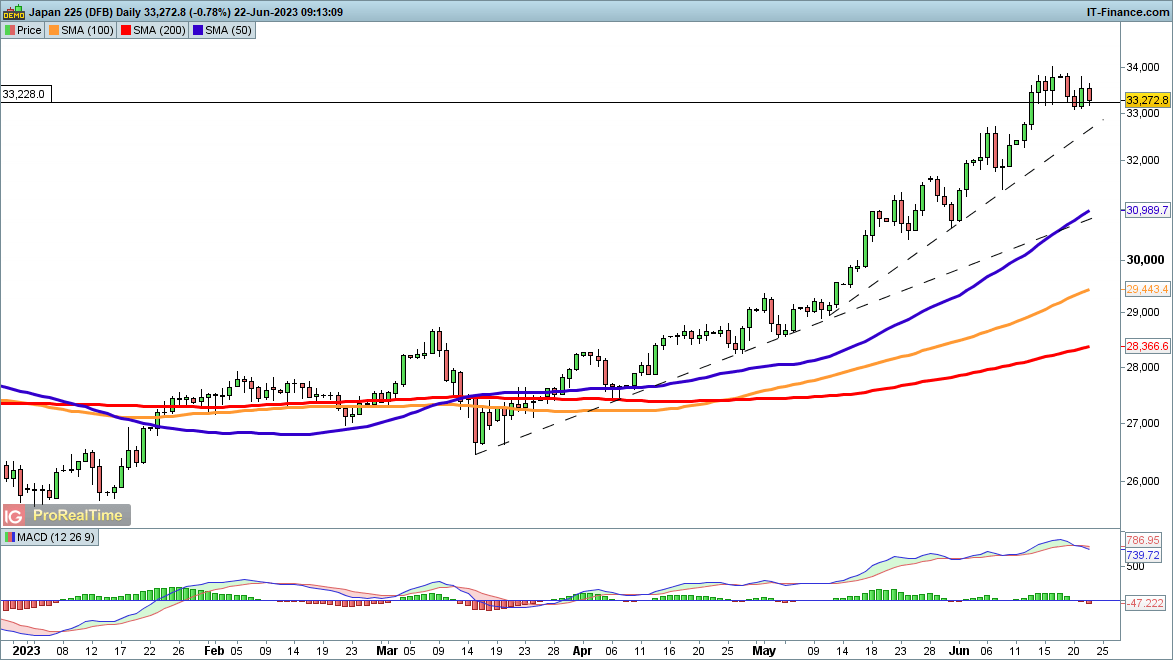
Nikkei 225 consolidates after hitting 30-year highs
The strong run higher here has stalled, the overall trend is intact. The price has consolidated since mid-June, which is a reflection of the overextension of the price following the gains made throughout April, May, and June.
Initial declines may target trendline support from early May, and then on down towards the 50-day SMA.
Nikkei 225 Daily Price Chart - June 22, 2023