


Major Indices Update:

Dax stumbles
Further gains here continue to be stemmed by the 17,000 area though the broader uptrend is still in place.
January witnessed a bounce from the 50-day simple moving average (SMA), that was followed up by a push to new record highs. The index has consolidated over the past two weeks, but the downside has been limited during that time.
A close back below the 50-day SMA might spark a pullback towards 16,500, or the January low at 16,346.
DAX Daily Chart
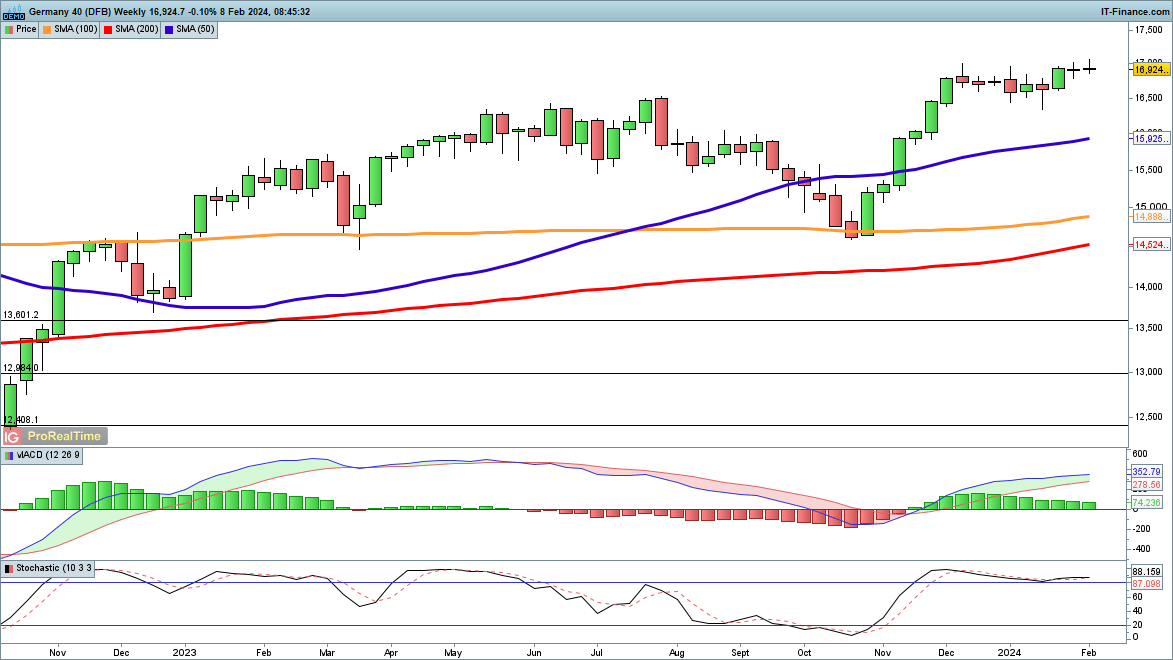
Source: IG, ProRealTime - Prepared by Christopher Beauchamp
S&P 500 on the edge of breaking 5000
The index came within a whisker of 5000 yesterday, building on its strong run so far in January.
Record highs continue to be the norm in US indices, and the S&P 500 is no exception. There has been no sign of any extended weakness, and from a macro standpoint, the index’s continued gains despite diminished expectations around a Fed rate cut indicate that this rally is not driven just by what the market expects the Fed will do.
Trendline support from the October low comes into focus around 4940, with a deeper pullback targeting the 50-day SMA, which has not been tested since early November.
S&P 500 Daily Chart
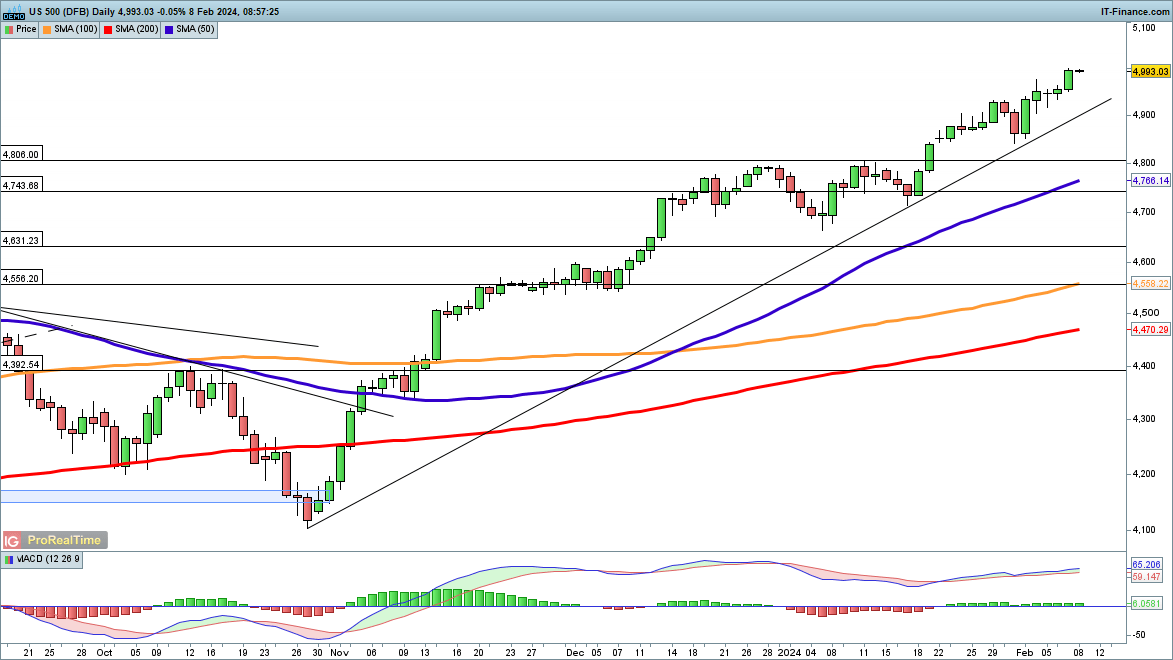
Source: IG, ProRealTime - Prepared by Christopher Beauchamp
At DailyFX, we analysed thousands of live accounts to discover what successful traders get right. Find out more by reading our summarised findings below:

Nasdaq 100 hits new peak
A new record high was recorded in this index too yesterday, maintaining the bullish run.
As with the S&P 500, the Nasdaq 100 has shrugged off the Fed’s restatement of its cautious view, and backed by strong earnings, has continued to gain.
In the short-term, a pullback could find support around last week’s lows at 17,120, or the previous record high from December at 16,978.
Nasdaq 100 Daily Chart
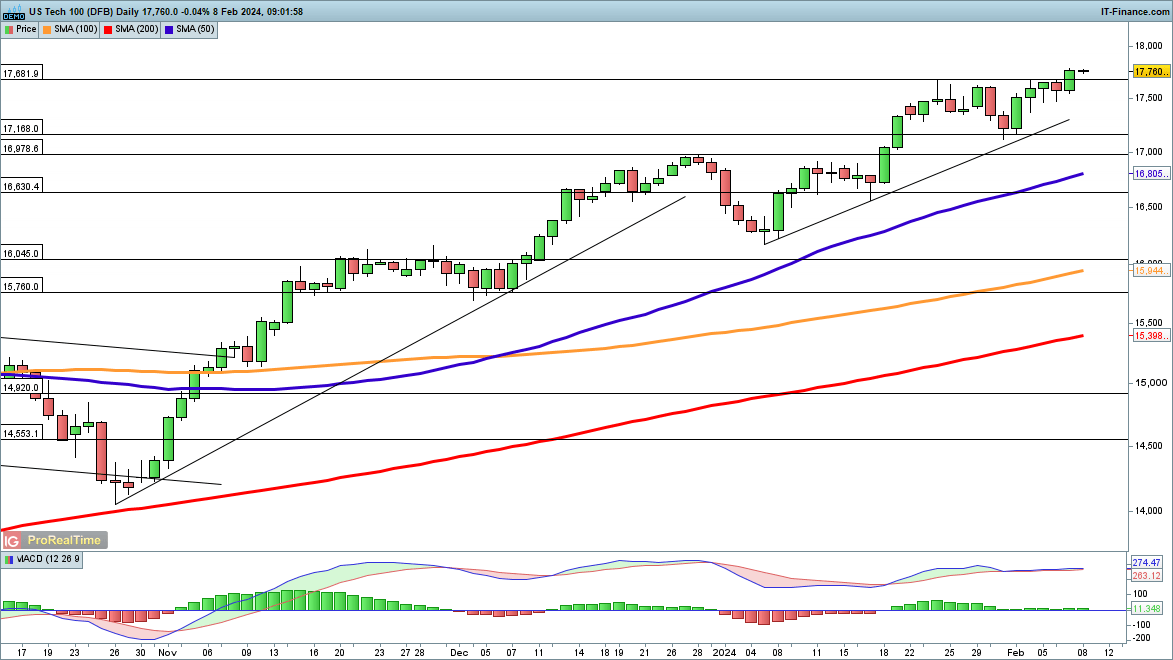
Source: IG, ProRealTime - Prepared by Christopher Beauchamp


