


British Pound (GBP/USD) Analysis and Charts
- Moody’s upgrade having little effect on Sterling.
- UK employment data and S&P PMIs are the next potential GBP drivers.

The British Pound is little changed as traders open their books for the week with little macro news around to start a move. The situation in the Middle East remains unpredictable and very volatile, while the proposed Israel move into Gaza is seemingly still on hold. Market sentiment is risk-averse at the open and likely to stay that way ahead of a week packed full of potentially volatile releases and events. The delayed UK unemployment will be released tomorrow morning (07:00 UK) before the latest S&P Global PMIs hit the screens at 09:30 GMT.
For all market-moving economic data and events, see the DailyFX Calendar
Another rating agency, Moody’s, was in the news recently after it upgraded the UK’s long-term outlook to stable from negative and reaffirmed the UK’s Aaa3 rating. Moody’s placed a negative outlook on the UK after ex-PM Liz Truss’s disastrous mini-budget last year. The next UK Budget will be on November 22nd.
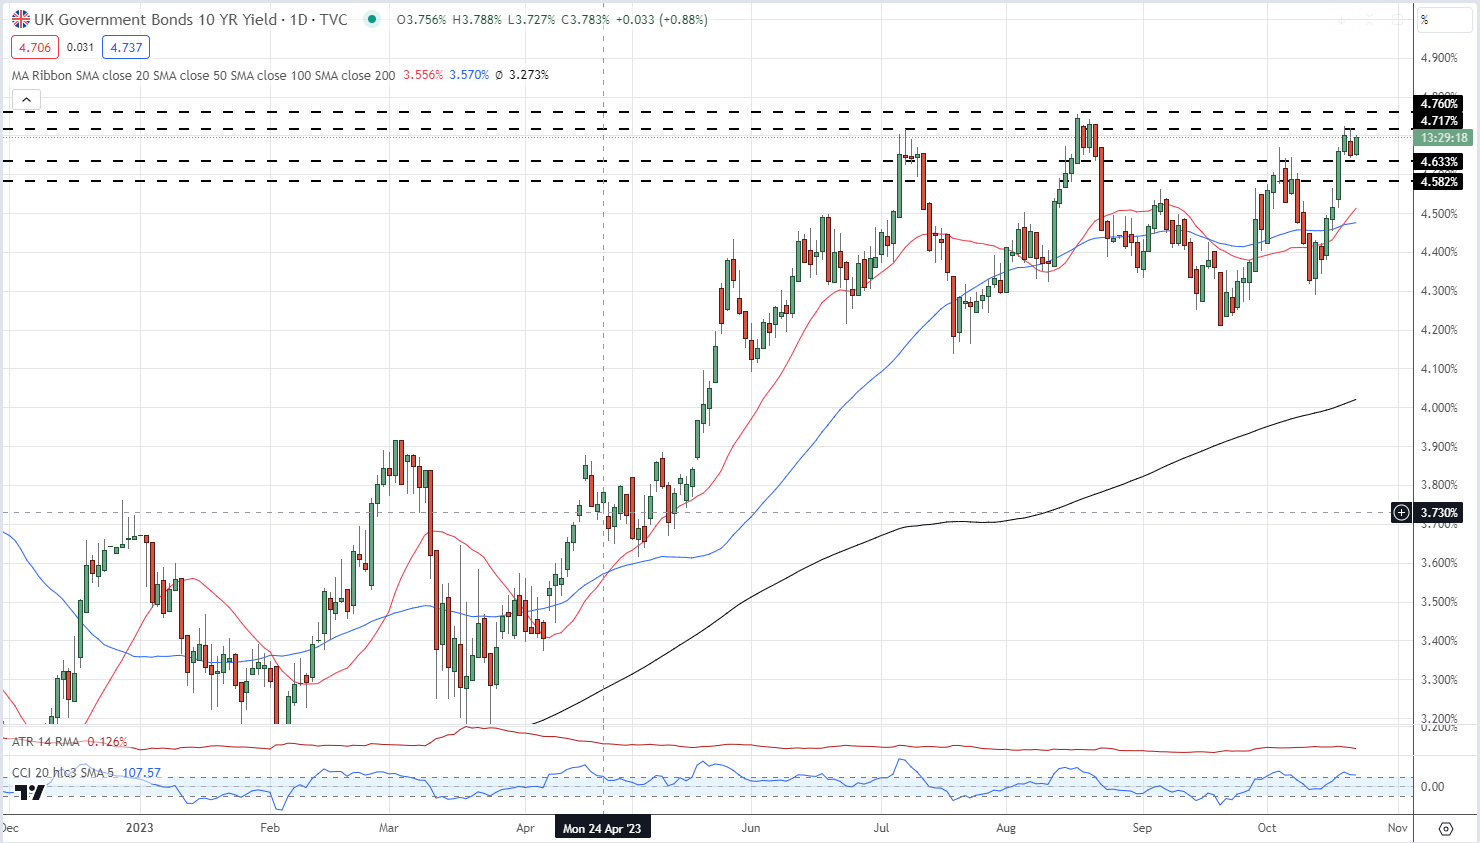
UK government bond yields remain elevated ahead of next week’s BoE meeting with the 10-year benchmark eyeing a fresh re-test of levels last seen in August 2008. The daily chart shows a triple top formation for UK 10-year yields, a pattern that normally suggests that the market is set to turn lower.
UK 10-Year Gilt Yields
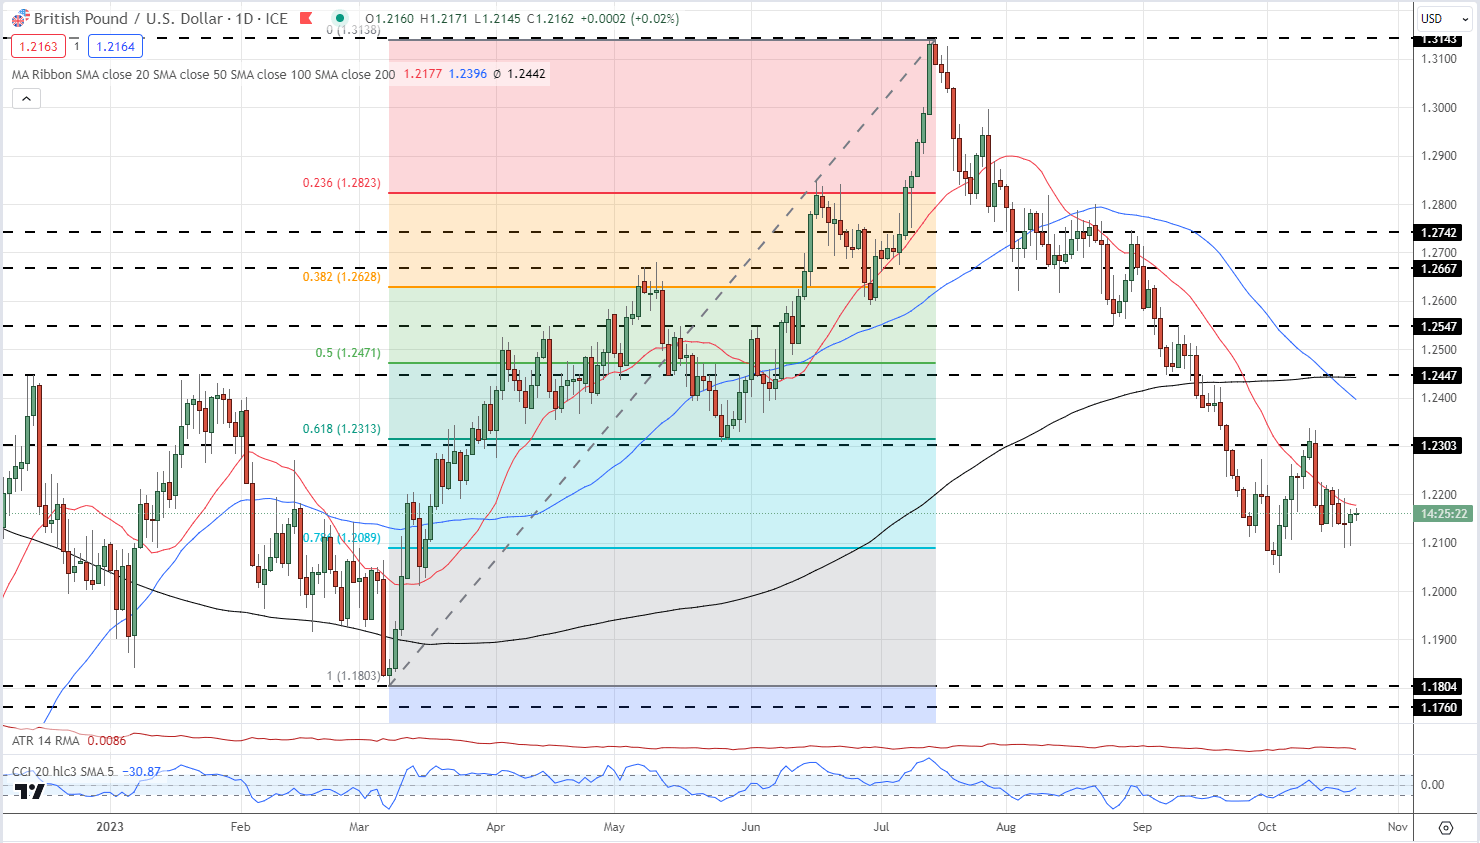
Cable remains stuck in a short-term range between 1.2089 (78.6% Fibonacci retracement) and a prior horizontal high of around 1.2303. The chart remains negative with a death cross formed last week, while the 20-day simple moving average continues to guide the pair lower.
Learn How to Trade GBP/USD

GBP/USD Daily Price Chart
IG Retail Trader data shows 69.28% of traders are net-long with the ratio of traders long to short at 2.26 to 1. The number of traders net-long is 0.86% higher than yesterday and 4.78% lower from last week, while the number of traders net-short is 1.22% higher than yesterday and 14.46% higher from last week.
We typically take a contrarian view to crowd sentiment, and the fact traders are net-long suggests GBP/USD prices may continue to fall.
| Change in | Longs | Shorts | OI |
| Daily | -4% | 1% | -2% |
| Weekly | -30% | 40% | -10% |
Charts using TradingView
What is your view on the British Pound – bullish or bearish?? You can let us know via the form at the end of this piece or you can contact the author via Twitter @nickcawley1.


