


Bitcoin Outlook: Neutral
- BTC/USD prices lack clarity after solid job data and ISM drive Dollar strength.
- Price action honors technical support and resistance as momentum fades
- Pressure builds in a tight range. Bullish above $24,000. Bearish below $22,000.

Bitcoin Price Action Lacks Clarity – Stronger Dollar Restricts Gains
Bitcoin prices fell lower after another week of high impact economic data. Although systemic risks remained elevated, volatility remained limited, slightly unusual given the economic uncertainty.
As the Federal Reserve, Bank of England (BoE) and European Central Bank (ECB) raised interest rates at their corresponding monetary policy meetings, BTC/USD ticked higher, before peaking at $24,258. Because market participants had already priced in the expected rate hikes that fell in-line with expectations, the news itself had little impact on the immediate reaction.
Visit DailyFX Education to learn about the role of central banks in global markets
Instead, it was the potent NFP (non-farm payroll) report that smashed expectations, with headline figures showing an additional 517k jobs had been added to the US economy last month. This was far above expectations of 185k. Despite economic uncertainty, the tight labor market data was also accompanied by better-than-expected ISM non-manufacturing PMI data which reflected an improvement in the service sector.
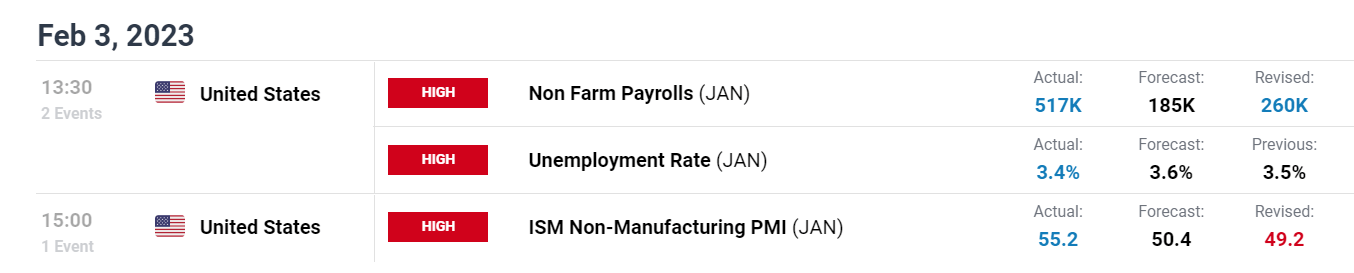
DailyFX Economic Calendar
The combination of what appears to be an improvement in the US economy, lifted the US Dollar, driving risk assets lower.
Bitcoin (BTC/USD) Technical Analysis
With the January high holding at $23,954, failure to drive prices above the $24,000 psychological handle limited the upside move. On the weekly chart below, the appearance of a doji candle reflected indecision, driving prices into a narrow range of support and resistance between $23,452 and $23,748 (weekly close and open).

Bitcoin Weekly Chart
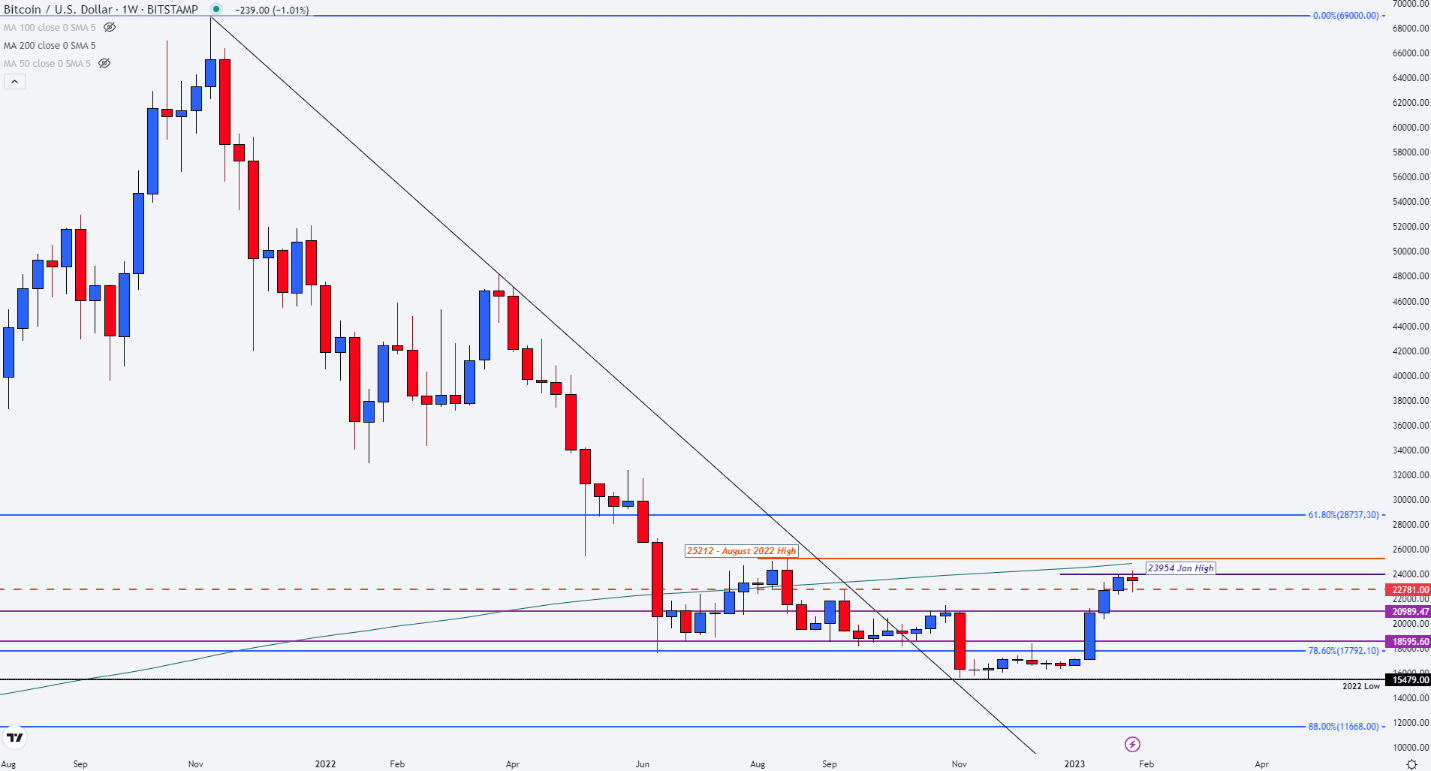
Chart prepared by Tammy Da Costa using TradingView
Although prices have managed to maintain a relatively stable recovery from the November 2022 low, risk aversion continues to impact the near and longer-term trajectory for crypto assets. From the daily chart, the $23,746 level has provided an additional barrier while $23,300 has limited bearish momentum. As $22,781 coincides with the September high, a move lower and a break of $22,400 could fuel bearish momentum, driving BTC towards $21,000.
Bitcoin Daily Chart
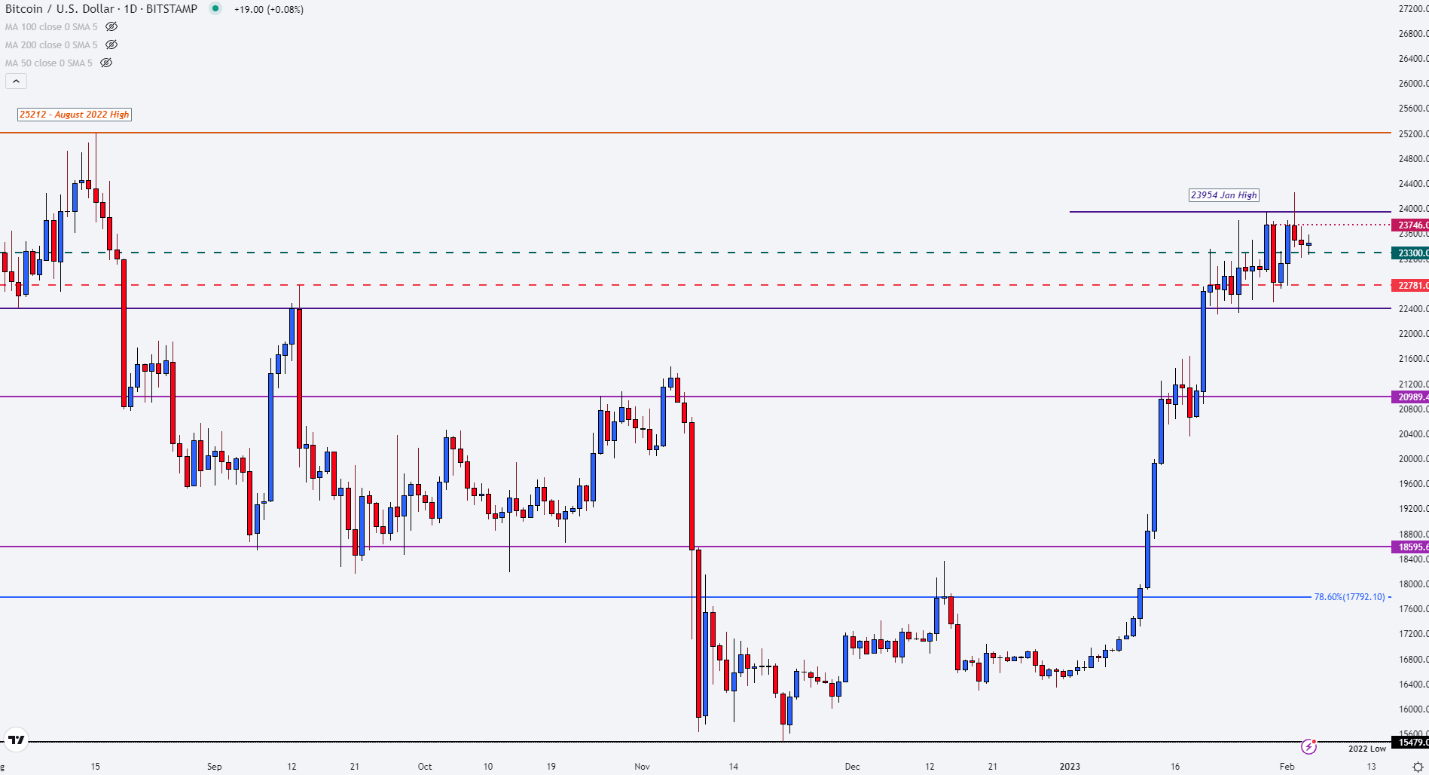
Chart prepared by Tammy Da Costa using TradingView
For the upside move, there are a few key levels for traders to keep a close eye on. Above $23,300, the 50-month MA (moving average) rests at $23,605. From there, the August high holds at $25,212 which could open the door for bullish continuation towards the 50-week MA at $25,346.
--- Written by Tammy Da Costa, Analyst for DailyFX.com
Contact and follow Tammy on Twitter: @Tams707


