Bitcoin (BTC) Prices, Charts, and Analysis:
- Have global interest rates peaked?
- Bitcoin is unable to break the 200-day simple moving average.
Download our Q4 Bitcoin Forecast for Free

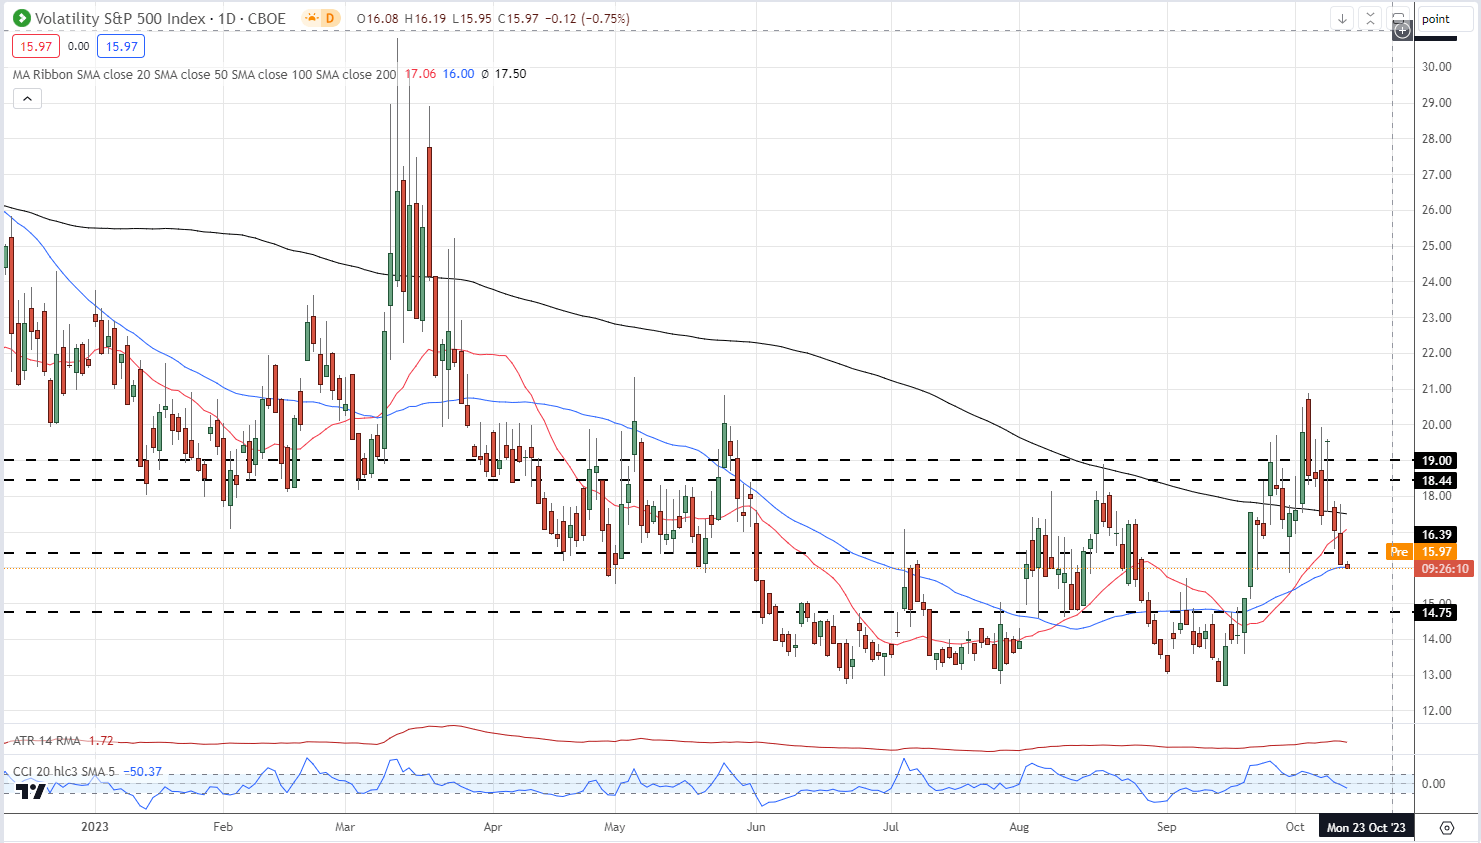
Bitcoin is trapped in a wide $25k - $32k range and is finding it difficult to make a concerted attempt at either support or resistance. The backdrop for the cryptocurrency market should be mildly positive with a raft of spot BTC and ETH ETFs expected shortly, while global interest rates are seen at, or very close to, their peaks. The latest raft of Fed speak has been dovish with a spread of FOMC members suggesting that with further tightening expected from previous rate hikes, inflation will continue to fall, easing the pressure on the US central bank to tighten monetary policy further. Traditional risk markets have pushed ahead in the past week, while the VIX – the ‘fear barometer’ - is currently printing its sixth red candle in a row.
VIX Daily Price Chart

The latest US inflation report will be released later in today’s session and any deviation from expectations – core y/y @4.1% and headline y/y @3.6% - may add a dose of volatility into the market.
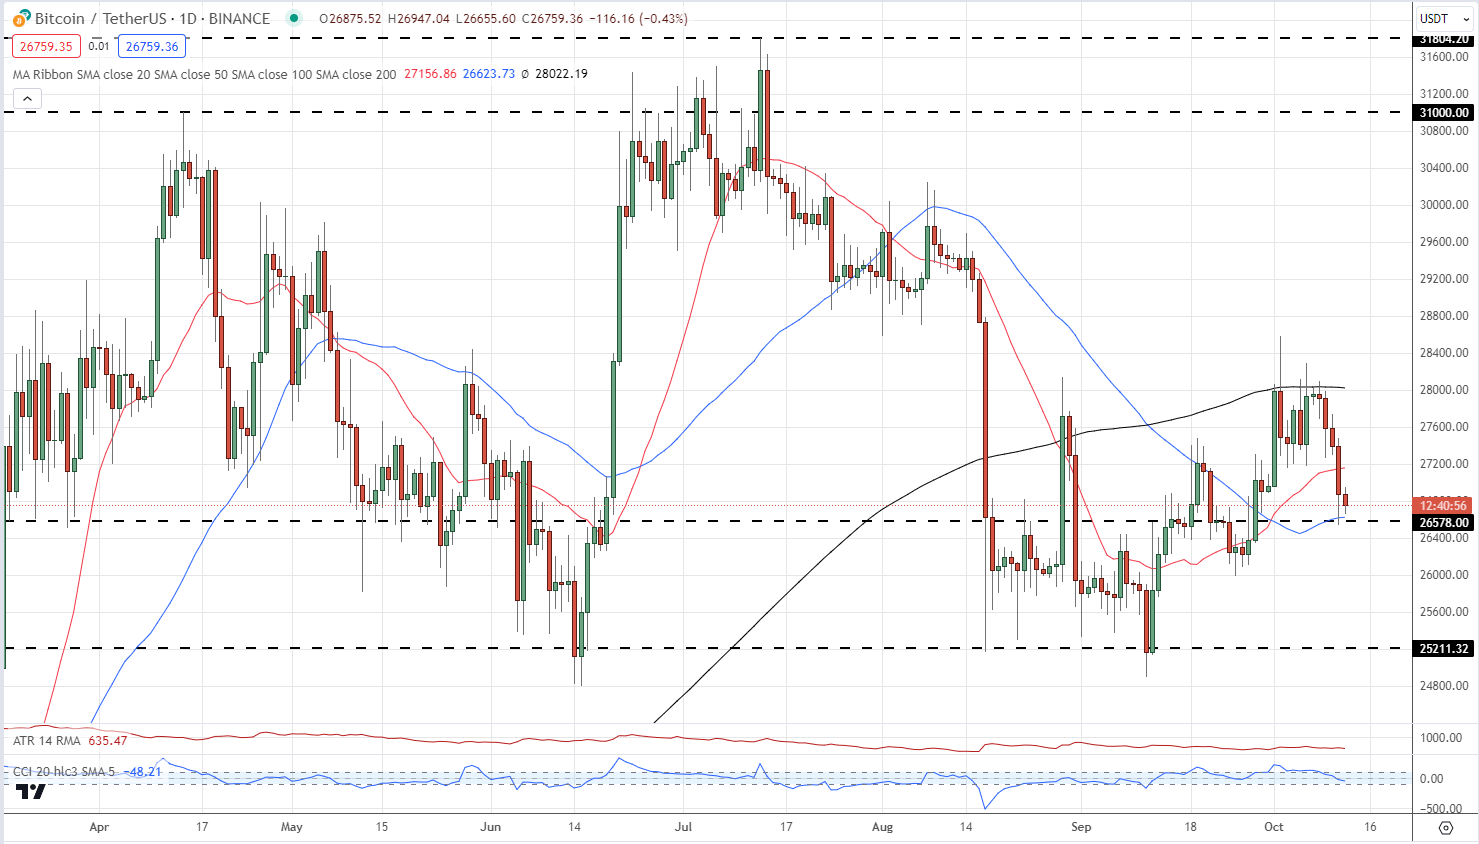
A look at the daily chart shows the spot BTC price is struggling to break the 200-day simple moving average. BTC is now pressing down on the 50-dsma that lines up with a prior level of note around the $26.5k area. Below here there is a cluster of old highs and lows down to $25k. These should stem any further sell-off. For Bitcoin to rally back to $32k resistance, the 200-dsma at $28k needs to be broken convincingly.
Bitcoin (BTC/USD) Daily Price Chart – October 12, 2023
Charts by TradingView
What is your view on Bitcoin – bullish or bearish?? You can let us know via the form at the end of this piece or you can contact the author via Twitter @nickcawley1.