


The US Dollar Index (DXY) bounced from the confluent support we looked at on Tuesday. The Euro’s sharp turn lower has more weakness in focus next week. USDCAD is starting to round its way higher out of an inverse head-and-shoulders pattern after testing its neckline, CADJPY doing opposite. Gold has a channel/bear-flag that if broken soon could turn the trading bias decisively bearish.
Technical Highlights:
- USD Index room to go higher, Euro lower
- USDCAD test of neckline finished, higher it can go
- CADJPY head-and-shoulders break could be near
- Gold channel/bear-flag could give decisive trading bias
See where our team of analysts see your favorite markets and currencies headed in the in the DailyFX Trading Forecasts.
USD Index room to go higher, Euro lower
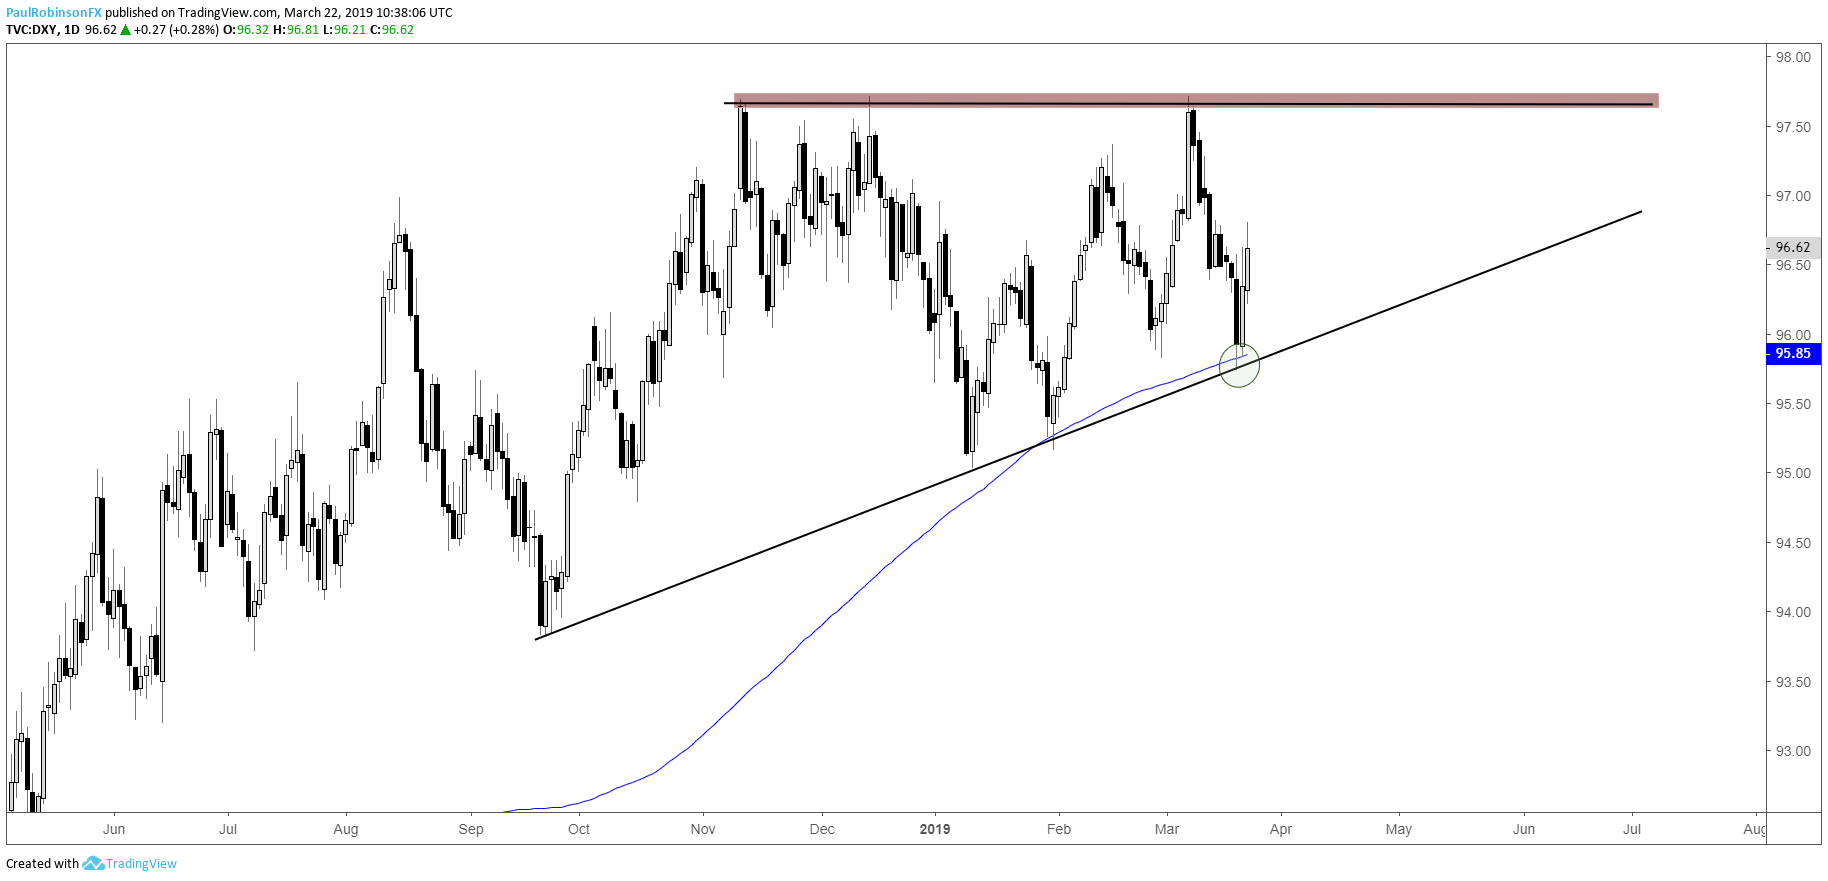
The US Dollar Index (DXY) bounced from confluent support by way of the underside of an ascending wedge and the 200-day, a spot discussed the other day as being quite important. This keeps the Dollar’s chances at building an impressive ascending wedge in play. For now, got to pick your spots wisely in this low-vol environment but the trading bias is higher.
US Dollar Index (DXY) Daily Chart (Ascending wedge remains in play)
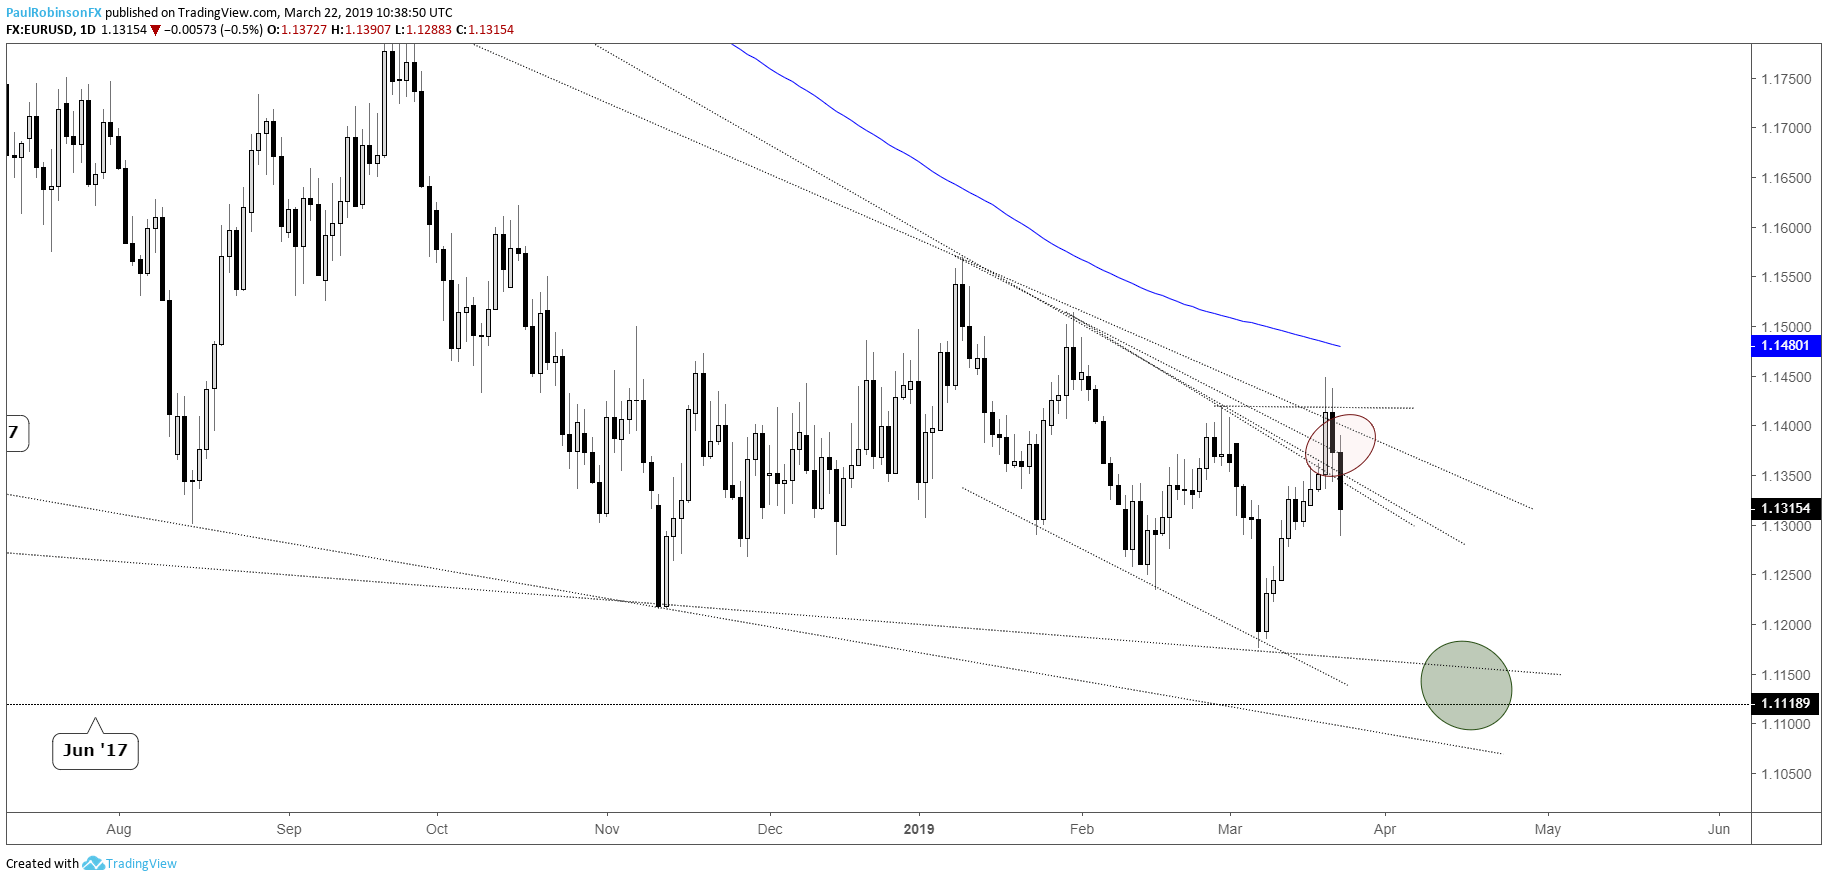
The Euro turned down from resistance the other day and then downbeat data this morning kicked EURUSD a bit more. Driving the DXY is largely the Euro and with that in mind its weakness will be the primary reason we see the Dollar index rally. There might not be a lot of room left before a low is found again, with the area around 11200 and just beneath viewed as support.
EURUSD Daily Chart (Break lower to continue…)
USDCAD test of neckline finished, higher it can go
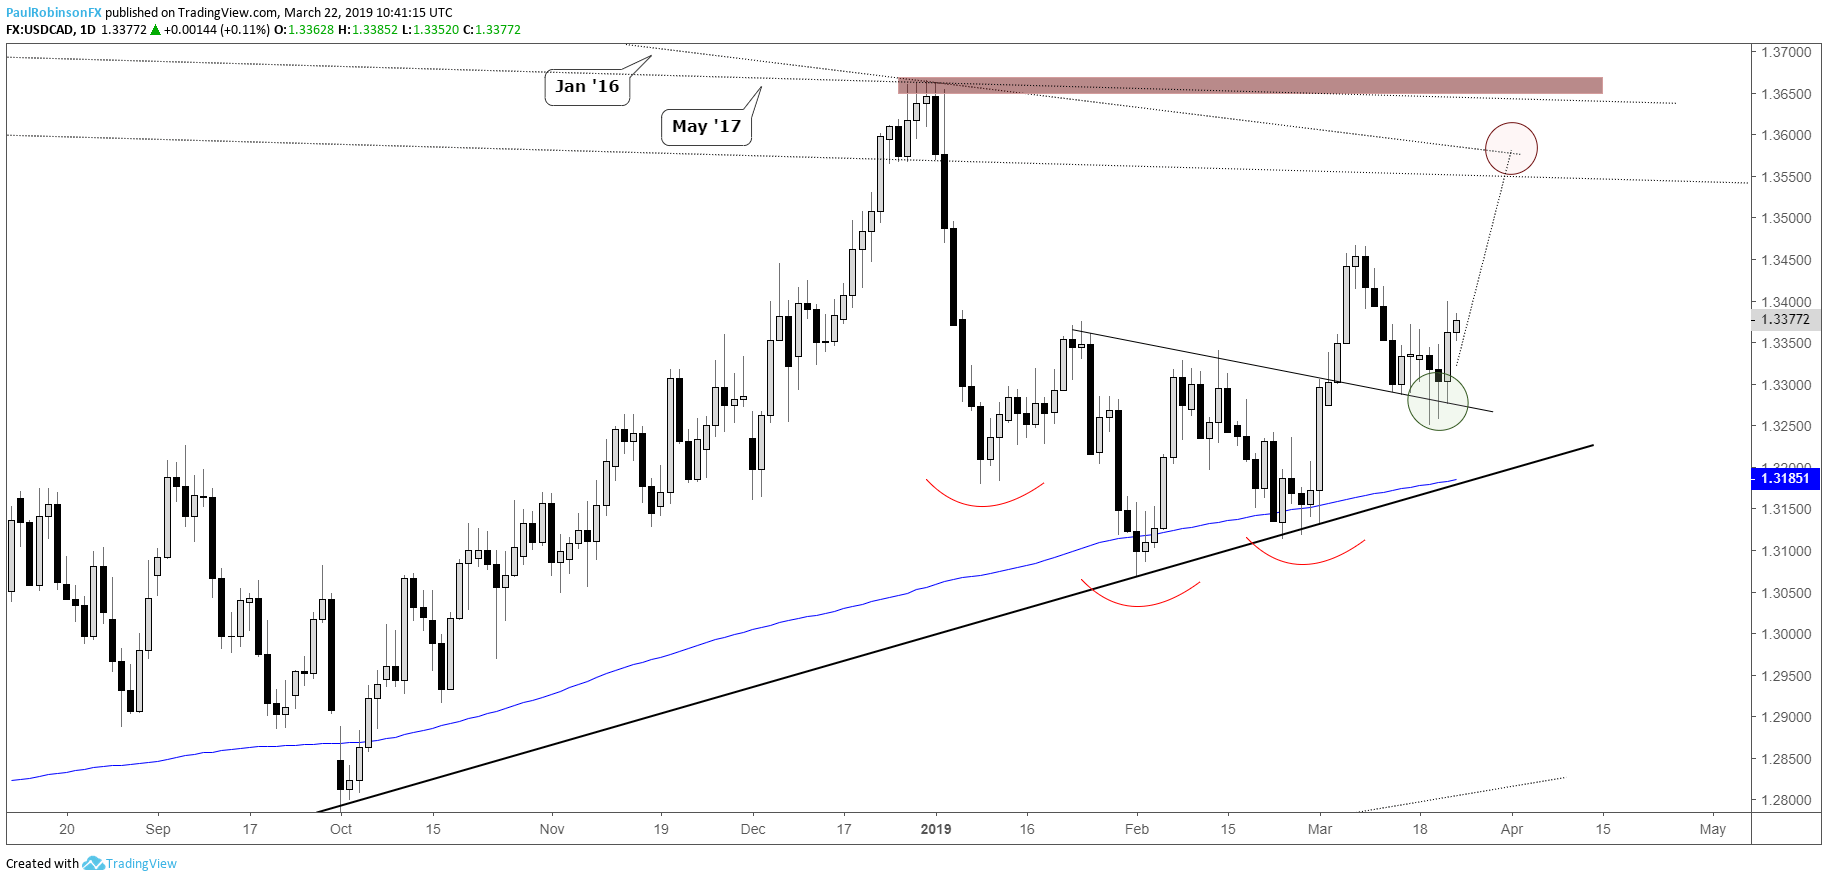
The other day USDCAD tested the neckline of a bullish inverse head-and-shoulders by posting a bullish key-reversal. This acted as confirmation of the retest and yesterday’s rally helped get it further out of the gate. Looking for more upside to come in the days ahead with an eventual target of 13570ish up to 13665.
USDCAD Daily Chart (inverse H&S to continue)
CADJPY head-and-shoulders break could be near
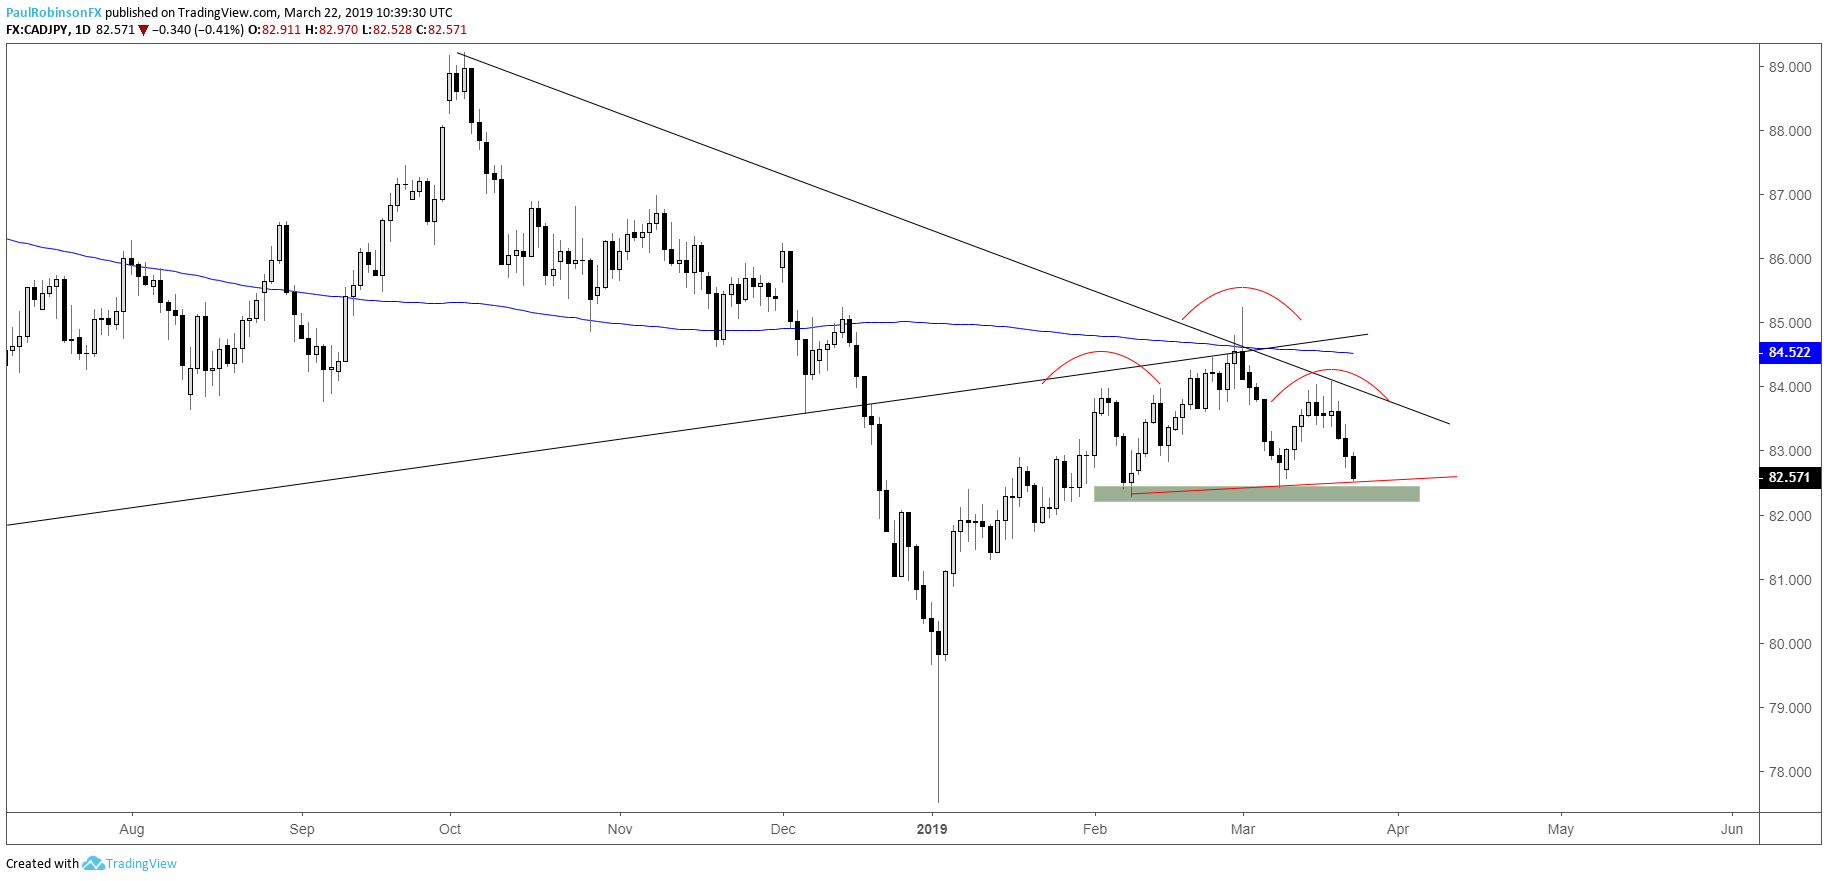
CADJPY isn’t doing so in exact opposite of USDCAD, but it is building its own version of a head-and-shoulders, in this instance the traditional bearish type. The neckline is right here, a break below and, just to err on the cautious side, a break of the Feb 6 low at 8226 should have CADJPY reeling further.
CADJPY Daily Chart (H&S neckline break may be soon)
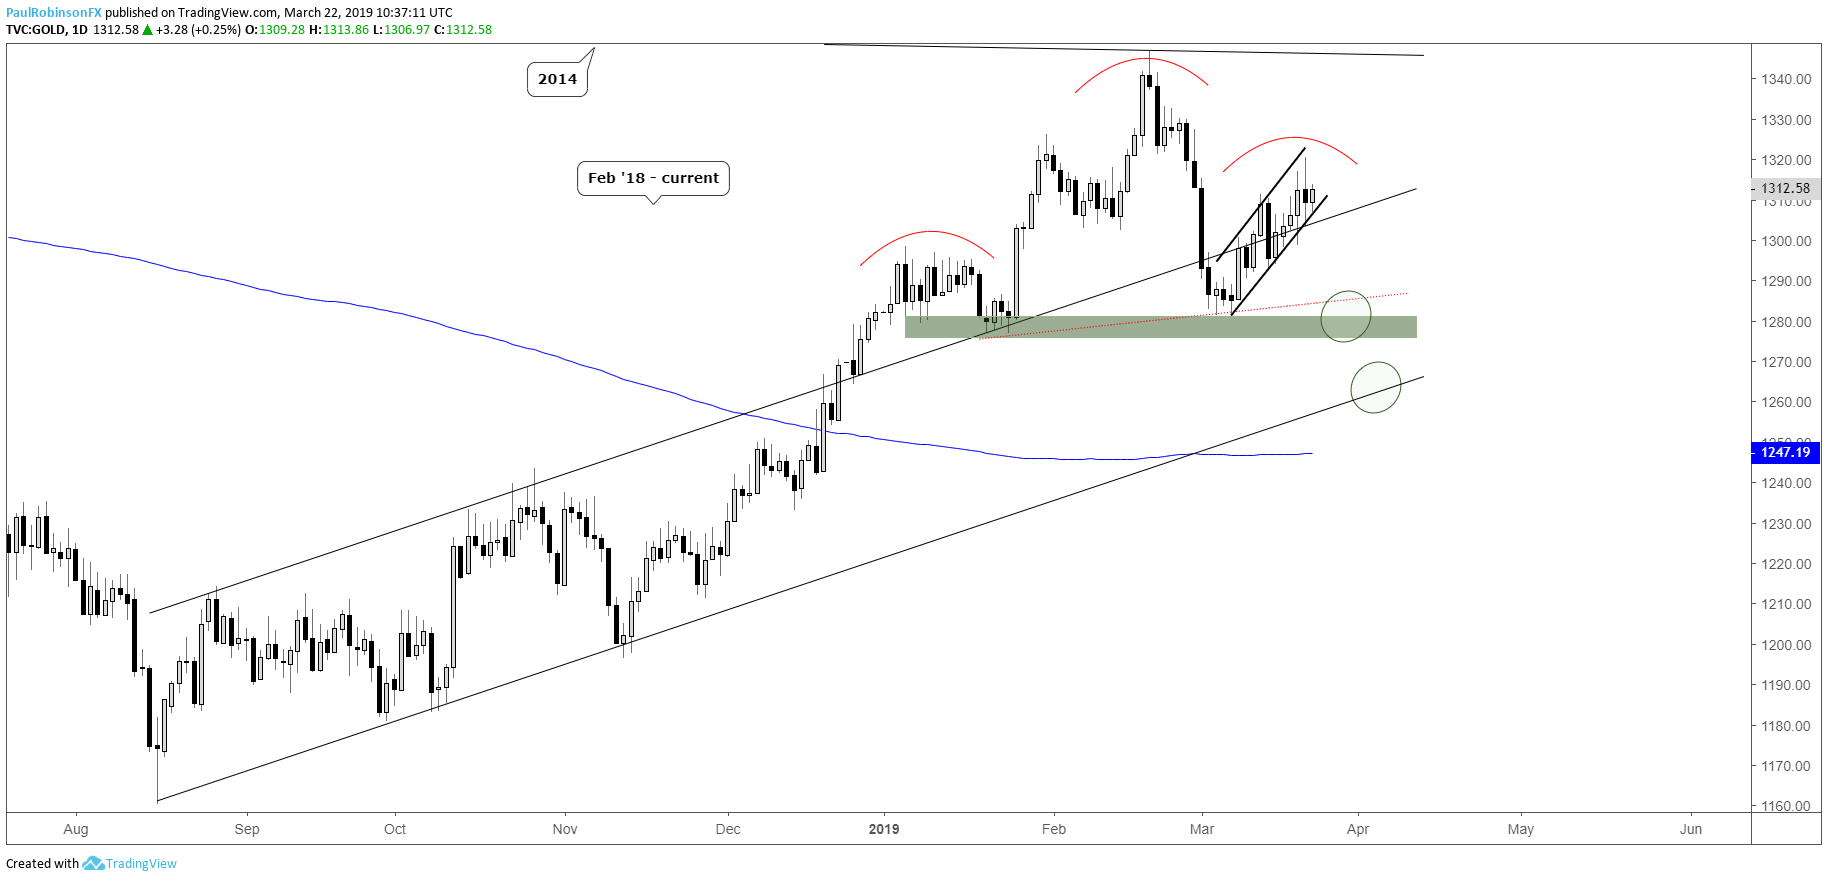
Gold channel/bear-flag could give decisive trading bias
Gold continues to work higher in a channel/bear-flag. Using it is a guide one could stay with a bullish short-term bias, but overall it looks like at some point gold will find bearish momentum again. A break of the lower parallel will be viewed as a catalyst for bringing sellers. If this happens then a drop into the would-be neckline of an H&S pattern is seen likely. From there we would need to see how the market responded before taking it another step further…
Gold Daily Chart (Channel/bear-flag)
Resources for Forex & CFD Traders
Whether you are a new or an experienced trader, DailyFX has several resources available to help you; indicator for tracking trader sentiment, quarterly trading forecasts, analytical and educational webinars held daily, trading guides to help you improve trading performance, and one specifically for those who are new to forex.
---Written by Paul Robinson, Market Analyst
You can follow Paul on Twitter at @PaulRobinsonFX


