


In looking for opportunities in the equity index and commodity sectors, one market (DAX) stands out while others are in need of a little more time before solid risk/reward opportunities present themselves. Gold looks like it could have another leg higher coming soon, same with oil but obviously from a different perspective.
Technical Highlights:
- DAX has compelling chart set-up
- Gold price weakness could offer pullback opportunity
- Crude oil basing, move to 2008 trend-line could come soon
We just released new quarterly forecasts; to see our fundamental and technical insights on major markets and currencies, check out the DailyFX Q3 Forecasts.
DAX has compelling chart set-up
The DAX is currently trading in a zone of resistance extending from around 12550 up to ~12610. It’s an area of significance given its influence as both resistance and support as far back as February. What really gives the current context the most appeal, is the short-term technical pattern most visible on the hourly time-frame.
Looking at the hourly time-frame (cash session hours), a rising wedge has been forming over the past week or so. It has a corrective look and feel about it, that is it looks like a resumption of weakness is the more likely scenario. But we must first wait for the pattern to be confirmed.
Here are the scenarios we looked at:
- Wedge breaks the underside trend-line and the market starts rolling downhill.
- A top-side breakout unfolds, but quickly fails with the DAX dropping below the underside trend-line. This could be the most powerful outcome given the false breakout.
- A top-side breakout it sustained. This is viewed as perhaps the most difficult to take advantage of given the market’s extension off the lows – At the very least a bullish break would be reason to avoid shorting.
DAX Daily Chart (Solid resistance)

DAX Hourly Chart (Rising wedge)

For more in-depth fundamental and technical analysis, check out the Q3 Forecast for Global Equity Indices
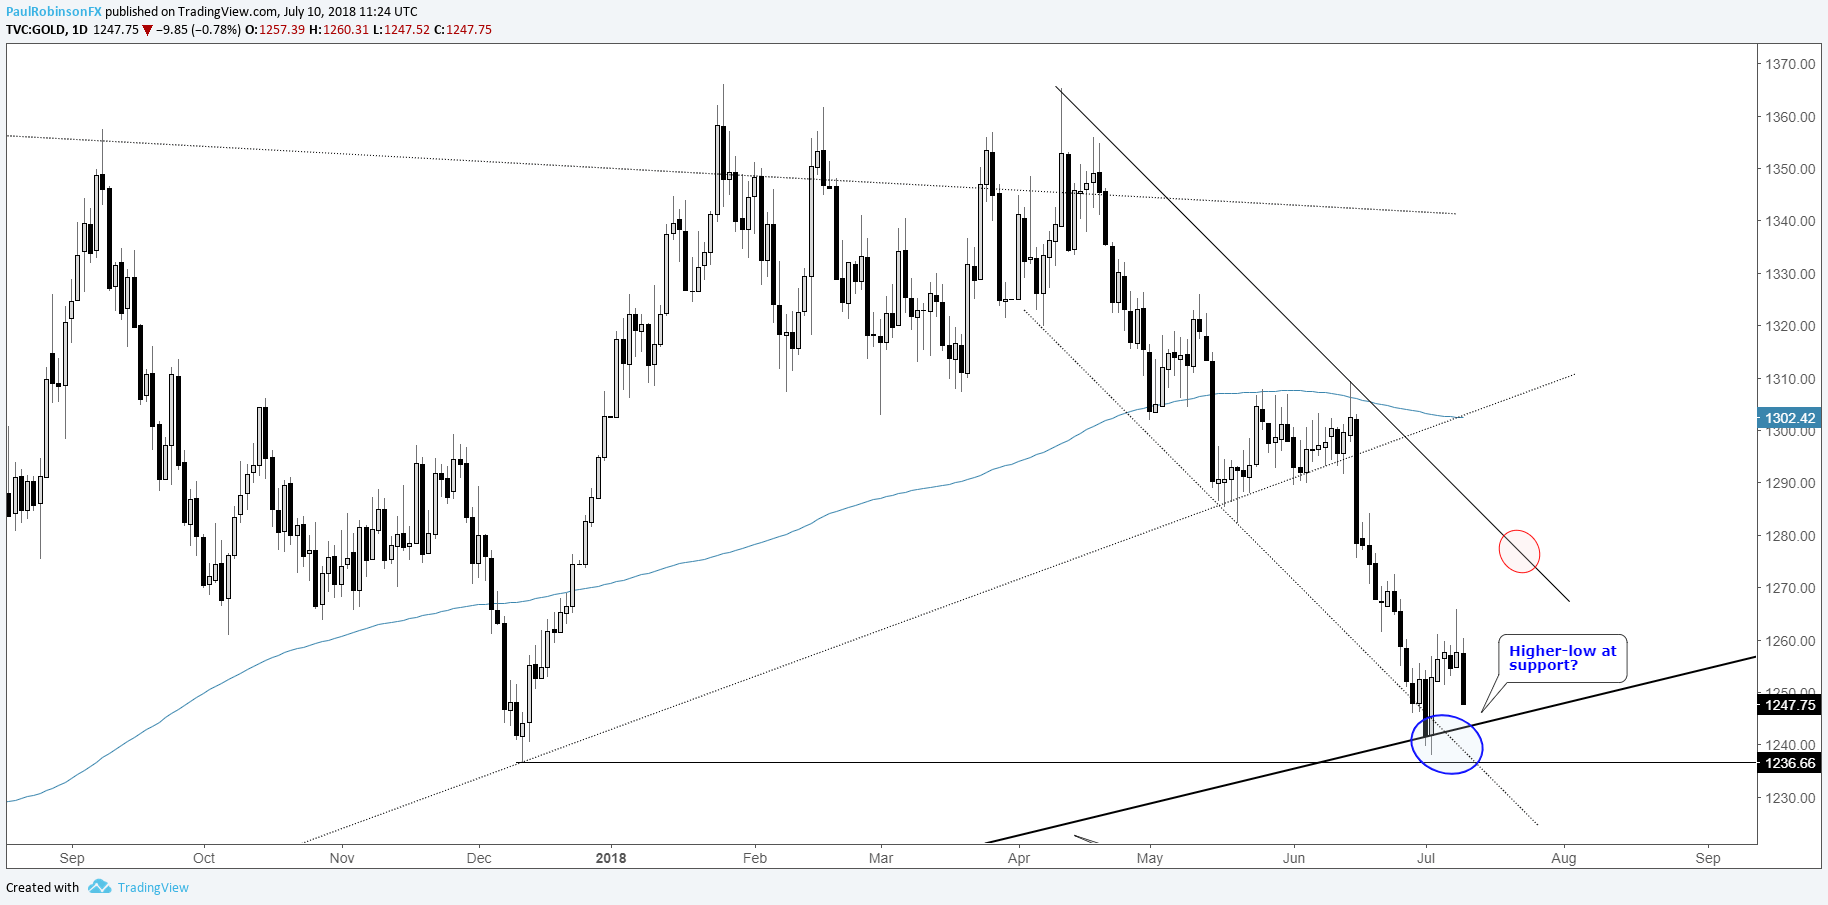
Gold price weakness could offer pullback opportunity
Last week, gold found buyers at the 2015 trend-line and just above the December low. The drop and bounce posted a key-reversal on the weekly time-frame. It’s arrival at such pivotal support warrants more upside. With stalling momentum on the current pullback, a dip-trip buying opportunity may present itself this week. If it does, the top-side target is the trend-line off the April high.
Gold Daily Chart (Looking for higher-low, big support below)
For more in-depth fundamental and technical analysis, check out the Q3 Forecast for Gold
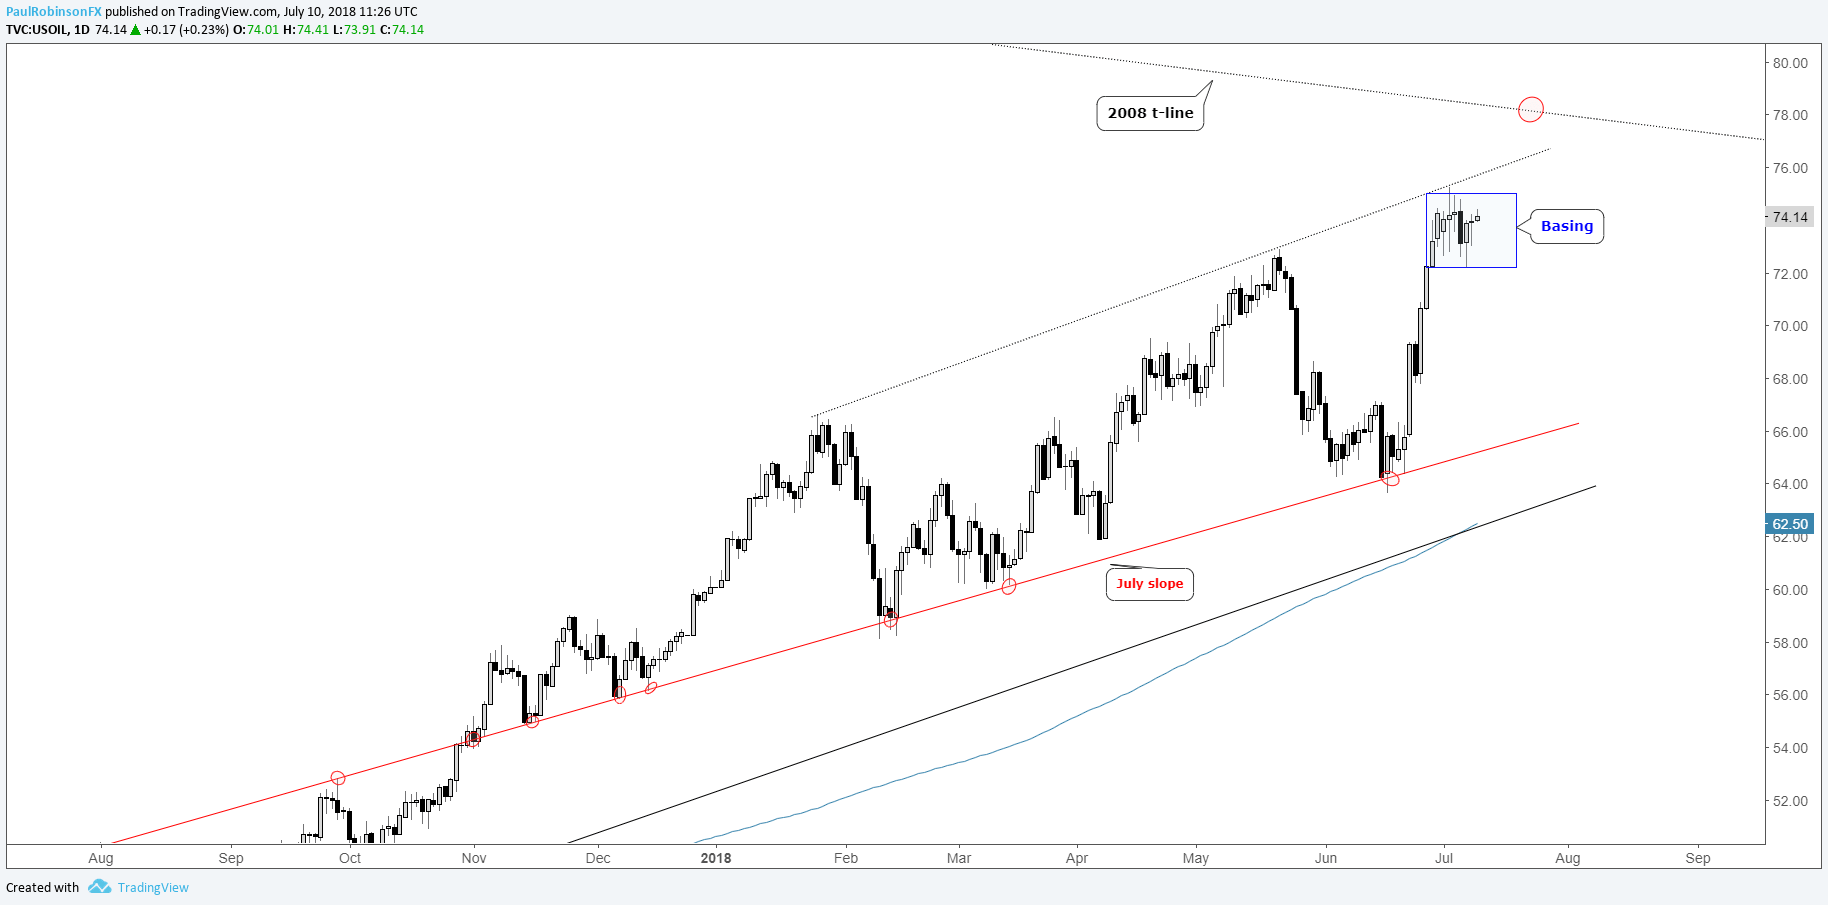
Crude oil basing, move to 2008 trend-line could come soon
Following crude oil’s big rip form the July slope it is basing as it works off overbought conditions. This comes at a top-side trend-line from January, but the overhead line isn’t expected to act as major resistance.
A little more digestion would be ideal before attempting to break higher. If all plays out in line with the trend, then the 2008 trend-line could come into play in the not-too-distant future. The line resides roughly around 79 (+/- a couple of handles). How price action plays out there (should oil rise to that point) will be of significant interest.
Crude Oil Daily Chart (Basing, 2008 t-line next?)
For more in-depth fundamental and technical analysis, check out the Q3 Forecast for Crude Oil
Resources for Index & Commodity Traders
Whether you are a new or an experienced trader, DailyFX has several resources available to help you; indicator for tracking trader sentiment, quarterly trading forecasts, analytical and educational webinars held daily, trading guides to help you improve trading performance, and one specifically for those who are new to forex.
---Written by Paul Robinson, Market Analyst
You can follow Paul on Twitter at @PaulRobinsonFX


