


Gold Price Outlook:
- Gold prices failed to retake the uptrend from the May 2019, March 2020, and March 2021 lows, and are nearing their monthly low.
- It remains the case that “selling the rally may be the modus operandi henceforth.”
- According to the IG Client Sentiment Index, gold prices surprisingly have a bullish bias in the near-term.

Ugly Price Action Post-FOMC
We’ve been ambivalent about rallies in gold prices for the past several weeks. Just two days ago it was noted that “what’s happening in gold prices is nothing more than a ‘dead cat bounce’…in recent Fed meetings and moreover, minutes from those Fed meetings, gold prices haven’t fared well as US policymakers inch ever-closer towards making a stimulus taper announcement.”
Price action in the 48-hours around the September Fed meeting have vindicated this apprehension towards the gold price rally that marked the start of the week. Now that the FOMC has offered some more clarity on its taper timeline and the tension around China’s Evergrande, the country’s second largest property developer, is being relieved, gold prices have unfavorable fundamental conditions in the near-term.
In particular, now that US Treasury yields are rising, which is translating into higher US real yields (nominal yields less inflation), one of the key factors that might have otherwise supported gold’s ascent has now become a veritable headwind.
Gold Volatility and Gold Prices’ Abnormal Relationship
Historically, gold prices have a relationship with volatility unlike other asset classes. While other asset classes like bonds and stocks don’t like increased volatility – signaling greater uncertainty around cash flows, dividends, coupon payments, etc. – gold tends to benefit during periods of higher volatility. Falling gold volatility and weak correlations suggests continued difficult trading may be ahead for gold prices.
GVZ (Gold Volatility) Technical Analysis: Daily Price Chart (September 2020 to September 2021) (Chart 1)
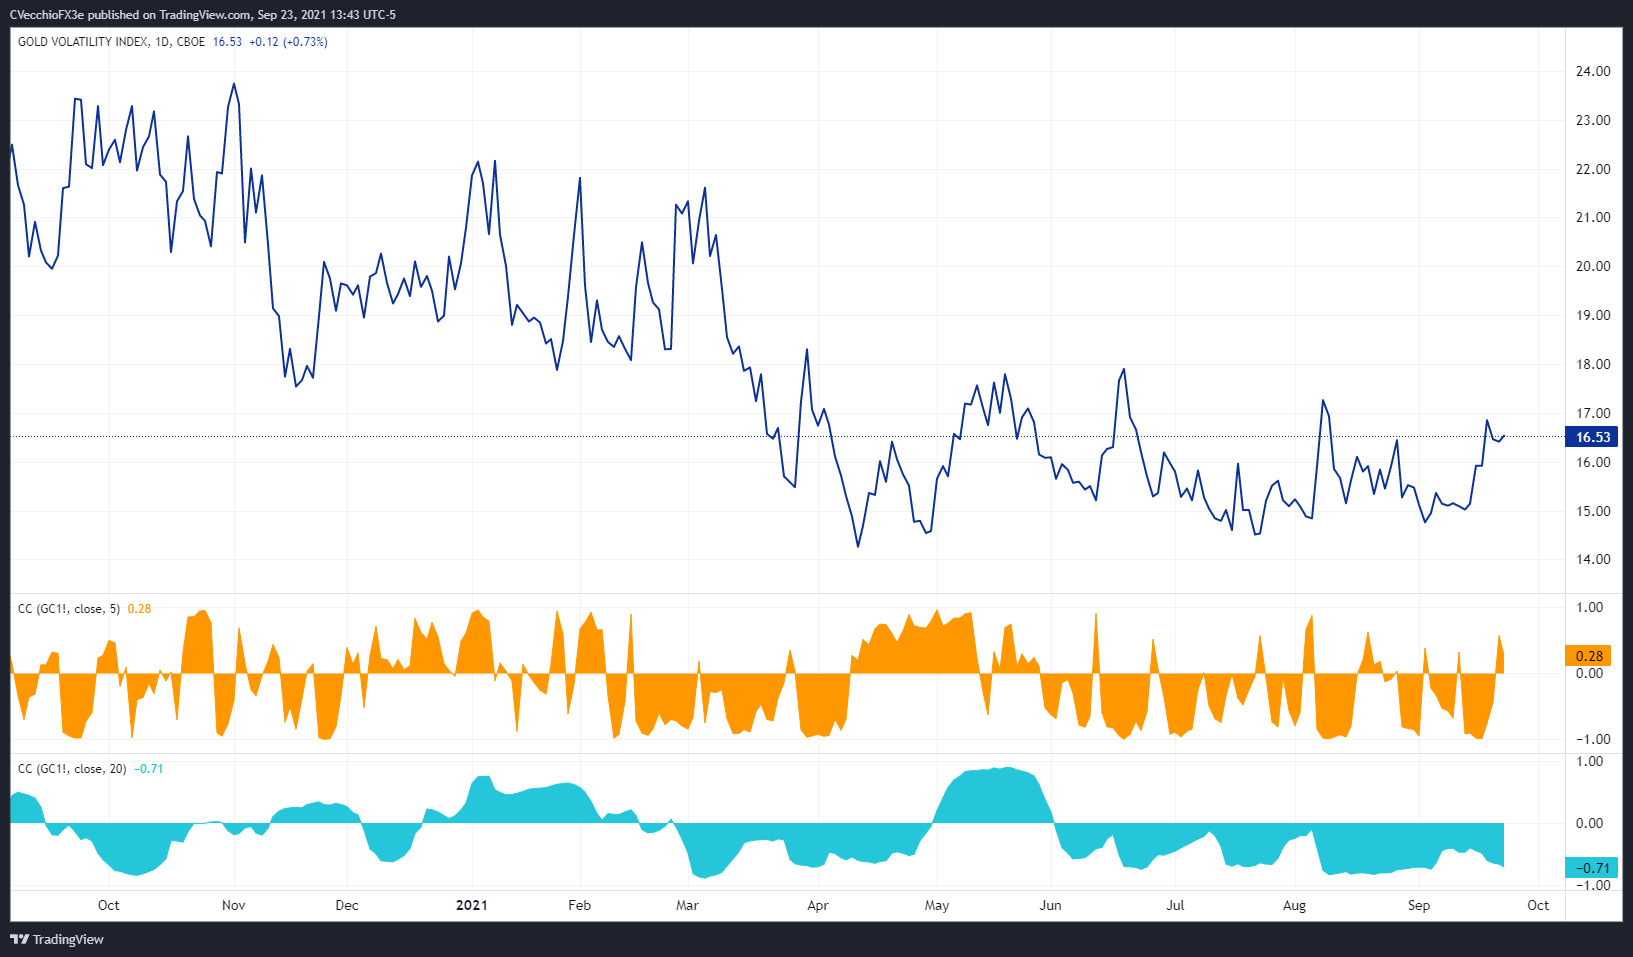
Gold volatility (as measured by the Cboe’s gold volatility ETF, GVZ, which tracks the 1-month implied volatility of gold as derived from the GLD option chain) was trading at 16.37. The relationship between gold prices and gold volatility remains abnormal. The 5-day correlation between GVZ and gold prices is -0.27 while the 20-day correlation is -0.71. One week ago, on September 16, the 5-day correlation was -0.98 and the 20-day correlation was -0.45.
Gold Price Rate Technical Analysis: Daily Chart (August 2020 to September 2021) (Chart 2)
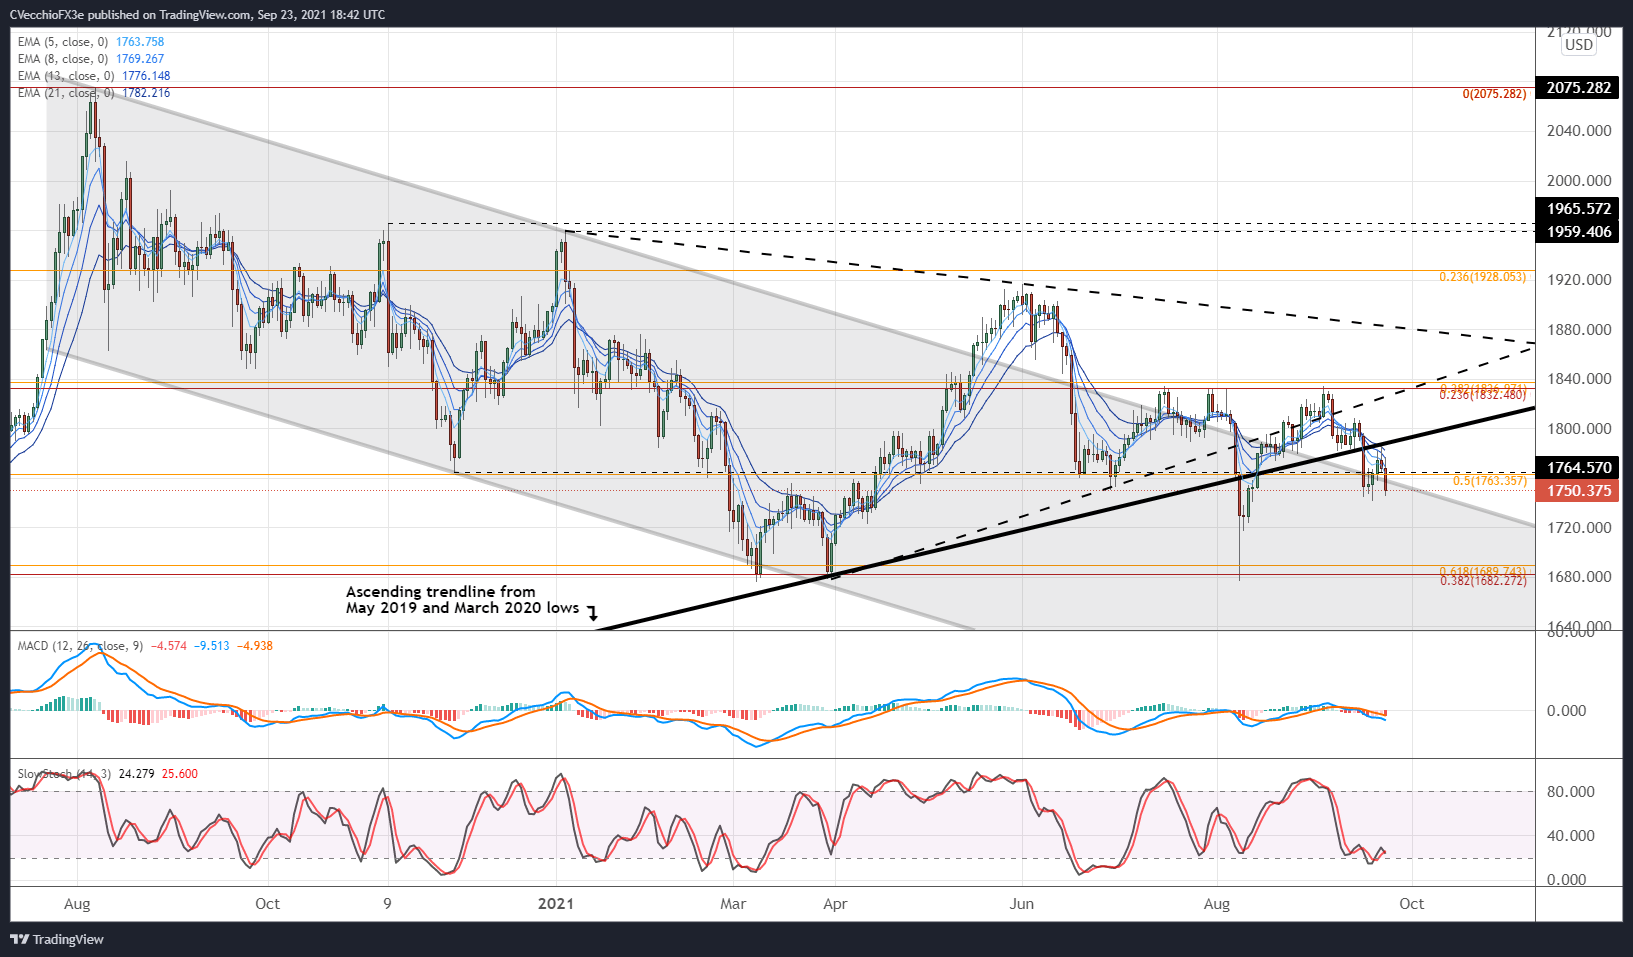
Earlier this week it was noted that “even though a rebound has transpired over the past 24-hours, gold prices remain below former support in the symmetrical triangle that encompassed price action from January through July, and more recently have traded below the ascending trendline from the May 2019, March 2020, and March 2021 lows. Further weakness cannot be ruled out at this time.”
Gold prices have since failed at these former support levels, duly treating them as resistance after what appeared to be a ‘dead cat bounce.’ More losses may be on the way given the posture of momentum indicators. Gold prices remain below their daily 5-, 8-, 13-, and 21-EMA envelope, which is in bearish sequential order. Daily MACD continues to decline while below its signal line, and daily Slow Stochastics are pushing back into oversold territory.
Gold Price Technical Analysis: Weekly Chart (October 2015 to September 2021) (Chart 3)
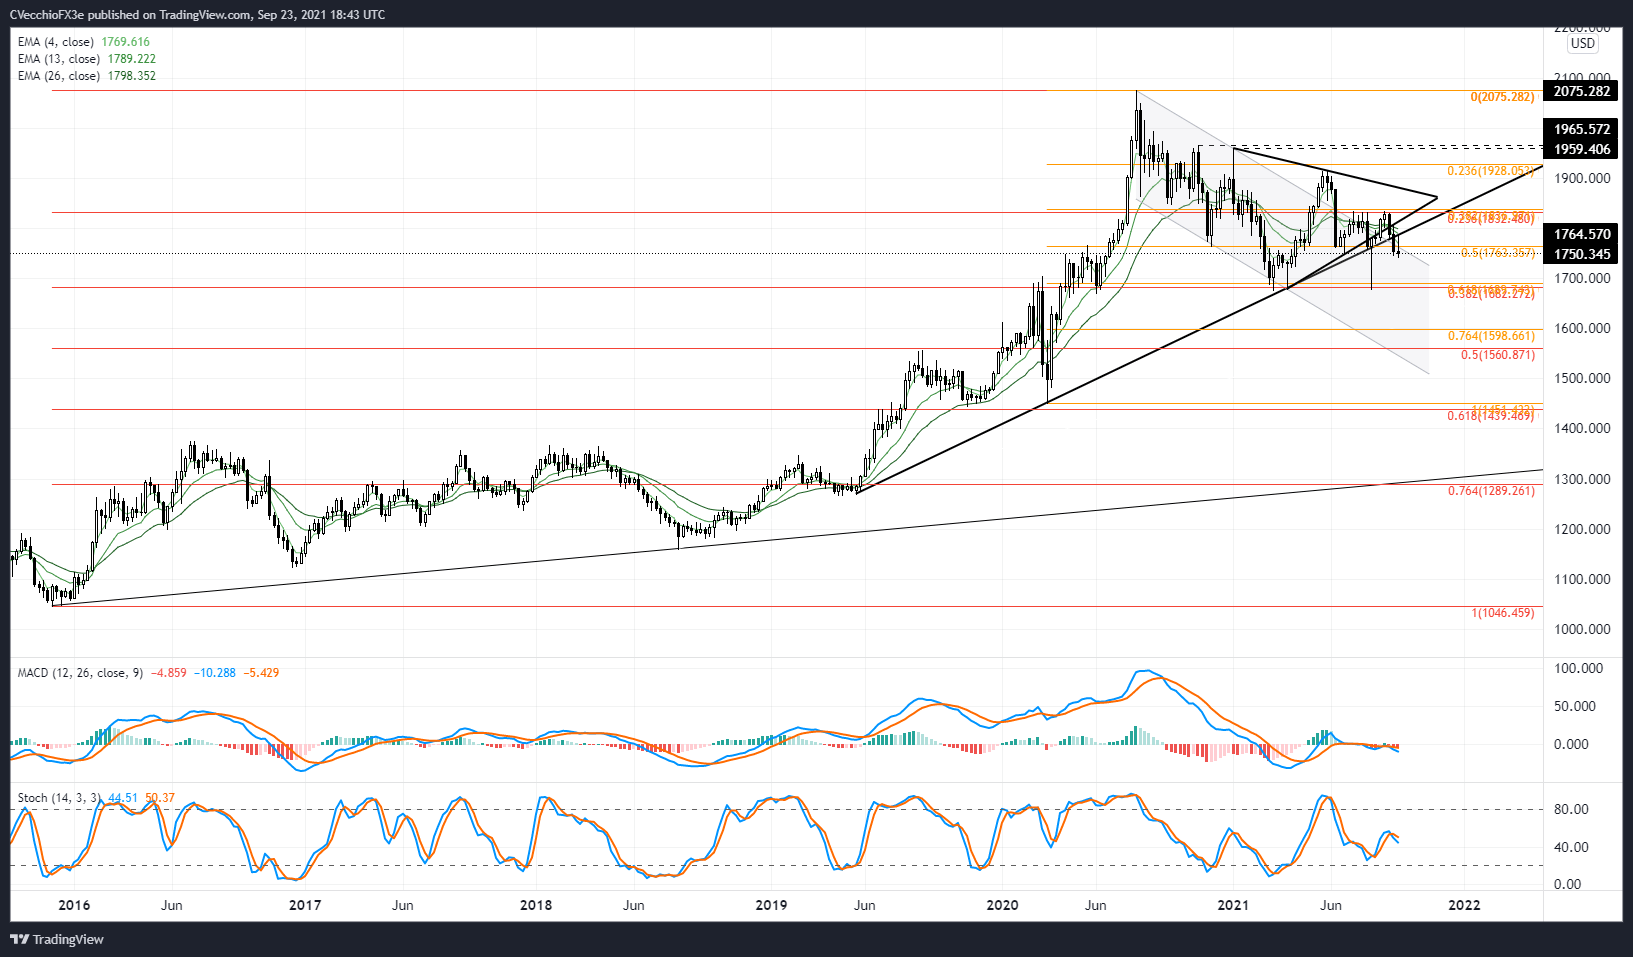
Gold prices’ technical structure on the weekly timeframe has not improved by any stretch of the imagination in the 48-hours around the September Fed meeting. The weekly 4-, 13-, and 26-EMA envelope continues to slide lower, while weekly MACD is dropping further below its signal line. Weekly Slow Stochastics are accelerating lower below their median line. It remains the case that “selling the rally may be the modus operandi henceforth.”

IG CLIENT SENTIMENT INDEX: GOLD PRICE FORECAST (September 23, 2021) (CHART 4)
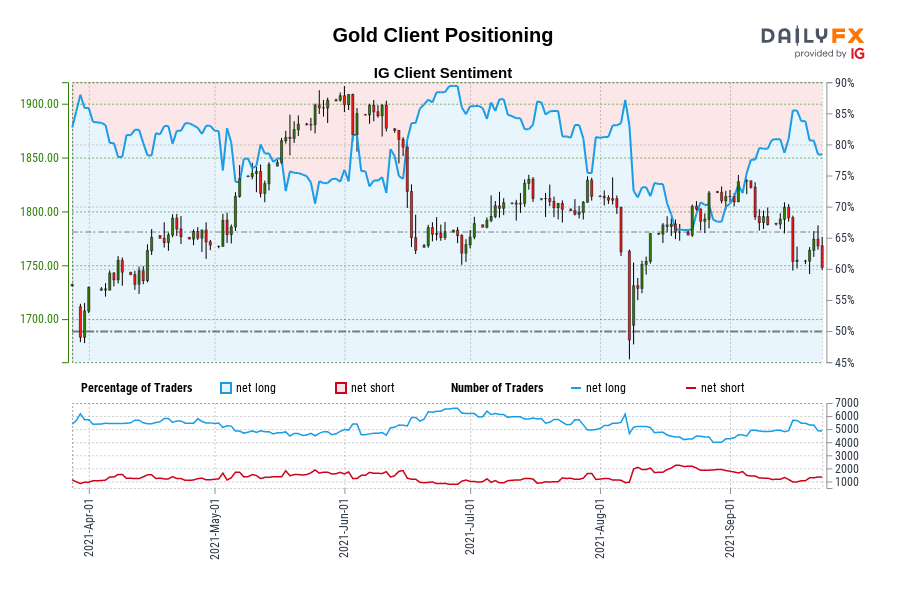
Gold: Retail trader data shows 74.85% of traders are net-long with the ratio of traders long to short at 2.98 to 1. The number of traders net-long is 1.67% lower than yesterday and 4.40% lower from last week, while the number of traders net-short is 15.61% higher than yesterday and 58.37% higher from last week.
We typically take a contrarian view to crowd sentiment, and the fact traders are net-long suggests Gold prices may continue to fall.
Yet traders are less net-long than yesterday and compared with last week. Recent changes in sentiment warn that the current Gold price trend may soon reverse higher despite the fact traders remain net-long.
--- Written by Christopher Vecchio, CFA, Senior Strategist


