


Weekly Fundamental Gold Price Forecast: Neutral
- Gold prices have seen their bullish breakout attempt fail to gain traction, although it’s still too soon to say that further gains are out of the question.
- The start of a new month brings about a wave of ‘high’ rated event risk on the DailyFX Economic Calendar, but much of the bad news will already be priced in to financial markets.
- The IG Client Sentiment Index suggests that gold prices in USD-terms (XAU/USD) may struggle in the days ahead.

Gold Prices Week in Review
Gold prices finished lower versus every single major currency, although losses were shallow enough that traders may not be convinced that the uptrend is finished just yet. After all, it was the week just before this past one that gold prices hit fresh yearly highs, and in some cases, all-time highs; the lone exception was gold in AUD-terms (XAU/AUD).
The top performing gold crosses this week were gold in JPY-terms (XAU/JPY), which only lost -0.11%, and gold in USD-terms (XAU/USD), which only lost -0.28%. Unsurprisingly, with the British Pound and Euro both turning broadly high versus the Japanese Yen and US Dollar, gold prices in both GBP-terms (XAU/GBP) and EUR-terms (XAU/EUR) proved weaker, falling back by -1.78% and -2.11%, respectively. Gold in CHF-terms (XAU/CHF) wasn’t as weak (-1.29%) though still dragged down by the performance of the European currencies, otherwise offset by traders shedding the low yielding, safe havens.
The commodity currencies continue to trade higher, tracking global equity markets as risk appetite broadly rebounds, decreasing the desire by market participants to hold safe haven assets like gold. The continued run higher by the Australian and New Zealand Dollars in particular left gold in AUD-terms (-2.26%) and gold in NZD-terms (-2%) downtrodden over the past week.
Top FX Events in Week Ahead
The start of a new month brings about a wave of ‘high’ rated event risk on the DailyFX Economic Calendar, but much of the bad news will already be priced in to financial markets.
- On Monday, gold in USD-terms (XAU/USD) will be in focus as slight rebounds are anticipated to be seen in the dueling US Markit Manufacturing and ISM Manufacturing PMIs.
- On Tuesday and Wednesday, gold in AUD-terms (XAU/AUD) will be of primary interest given the June RBA rate decision and the Q1’20 Australia GDP figure.
- Also on Wednesday, gold in CAD-terms (XAU/CAD) will likely see greater action with the June BOC rate decision on tap.
- On Thursday, all eyes will be on gold in EUR-terms (XAU/EUR) as the June ECB rate decision arrives.
- On Friday, attention turns back to gold in CAD-terms (XAU/CAD) and gold in USD-terms (XAU/USD) with the releases of the June Canada jobs report and the June US nonfarm payrolls report.
Gold Prices Struggle After Exiting Triangle Consolidation
The main point of reference for gold prices is gold in USD-terms (XAU/USD), which is where our attention will exclusively lie for the rest of this note. It’s worth considering the struggle that gold prices have faced over the past week, experiencing a rush to fresh yearly highs in all but one pair (XAU/AUD), only to see gains slip away and prices reverse lower – across all pairs – in the final week of May.
The backdrop of risk appetite improving – equity markets rallying, safe haven currencies being sold in favor of riskier currencies typically more sensitive to economic growth – has brought into question the viability of the recent effort by gold prices to reach new highs. In other words, it’s very possible that the gold market may have reached a point of exhaustion.
Gold Price (XAU/USD) Technical Analysis: Daily Chart (May 2019 to May 2020) (Chart 1)
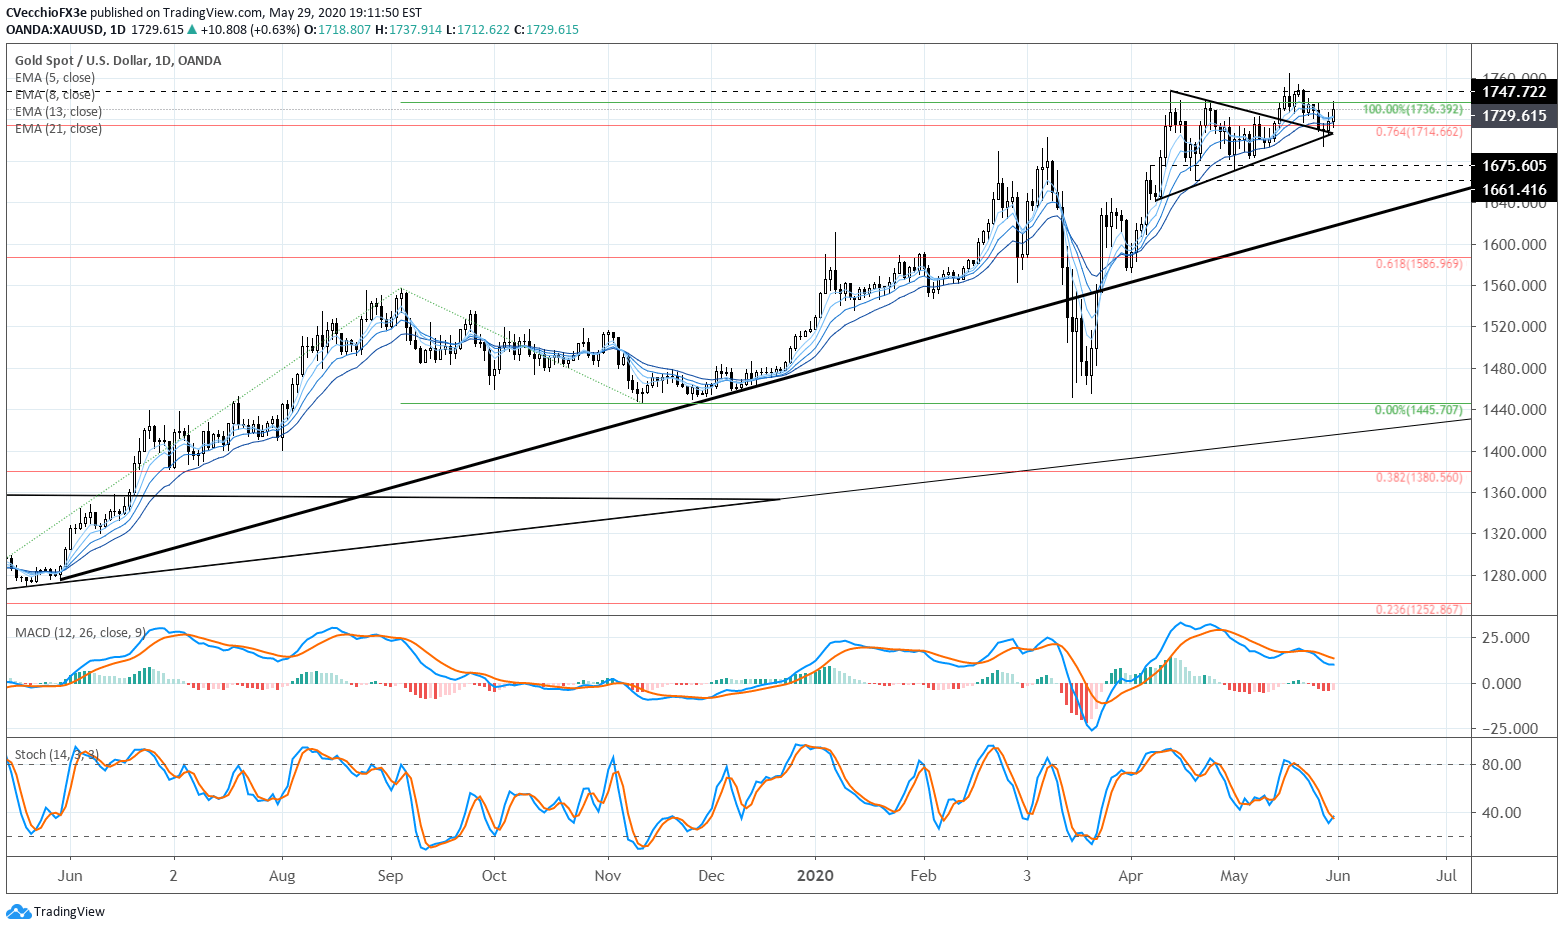
On May 18, gold prices were able to climb to a fresh yearly high, following through on the prior Friday’s breakout from the sideways range carved out between the April 14/2020 high at 1747.72 and the April 21 swing low at 1661.42. This was expected, as we noted ahead of the breakout that “given that gold prices rallied into this consolidation, the market retains an upside bias.”
Yet not all is well for gold prices. It was also noted that , “if gold prices do break higher from here, the near-term measured move calls for gains towards 1834.02.” That we’ve witnessed gold prices set a fresh yearly high and immediately turn lower warns of an exhausted market. Failure to reach the measured target of the symmetrical triangle would likely foreshadow a deeper pullback in the near-term, particularly if gold prices were to move below the daily 21-EMA (finished May at 1717.36).
Gold Price (XAU/USD) Technical Analysis: Weekly Chart – Inverse Head and Shoulders Pattern (May 2011 to May 2020) (Chart 2)

Gold prices have made significant progress within the confines of the multi-year inverse head & shoulders pattern, achieving their highest level since November 2012 earlier this week. It thus still holds that the rally into and through the 76.4% retracement (1714.66) must be viewed in context of the longer-term technical picture: the gold price inverse head and shoulders pattern that was triggered in mid-2019 is still valid and guiding gold price action.
Depending upon the placement of the neckline, the final upside targets in a potential long-term gold price rally, if drawing the neckline breakout against the August 2013 high at 1433.61, calls for a final target at 1820.99. This dovetails neatly with the measured move on the daily timeframe looking for gold prices to rally into 1834.02.
GOLD PRICE VERSUS COT NET NON-COMMERCIAL POSITIONING: DAILY TIMEFRAME (MAY 2019 TO MAY2020) (CHART 3)
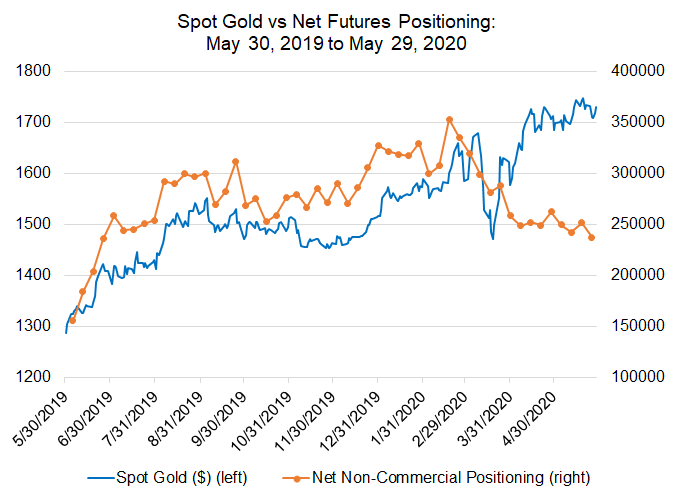
Next, a look at gold positioning in the futures market among speculators. According to the CFTC’s COT data for the week May 26, speculators decreased their net-long gold futures positions to 237.9K contracts, down from the 251.8K net-long contracts held in the week prior. Yet despite gold prices holding near their yearly highs, the futures market continues to shed long positions: there has been a near -33% contraction in net-long contracts since the week of February 18, when 353.6K were held by speculators.
This is, perhaps, the most interesting aspect of the gold trade at present time: even as gold prices have rallied into fresh yearly highs, positioning in the futures market continues to decline; and the continued drawdown in net-longs held by speculators has been met by gold prices sustaining their gains.
There are two points to consider on this: first, speculators are likely selling out of their gold longs in order to finance their new equity longs; and two, that gold prices haven’t declined suggests that commercial buyers are stepping in to absorb speculators’ offers.
IG CLIENT SENTIMENT INDEX: GOLD PRICE FORECAST (MAY 29, 2020) (CHART 4)
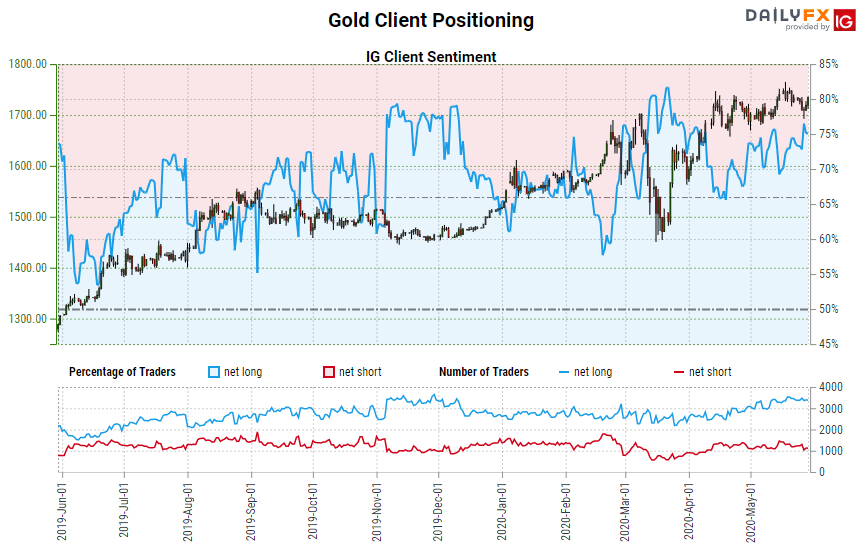
Gold: Retail trader data shows 75.43% of traders are net-long with the ratio of traders long to short at 3.07 to 1. The number of traders net-long is 1.61% higher than yesterday and 0.26% lower from last week, while the number of traders net-short is 8.89% lower than yesterday and 8.89% lower from last week.
We typically take a contrarian view to crowd sentiment, and the fact traders are net-long suggests Gold prices may continue to fall.
Traders are further net-long than yesterday and last week, and the combination of current sentiment and recent changes gives us a stronger Gold-bearish contrarian trading bias.

--- Written by Christopher Vecchio, CFA, Senior Currency Strategist


