Japanese Yen Technical Analysis Talking Points:
- USDJPY has fallen sharply this year
- It’s now pinned between two key retracement levels
- NZDJPY has weakened too, but its uptrend looks more solid


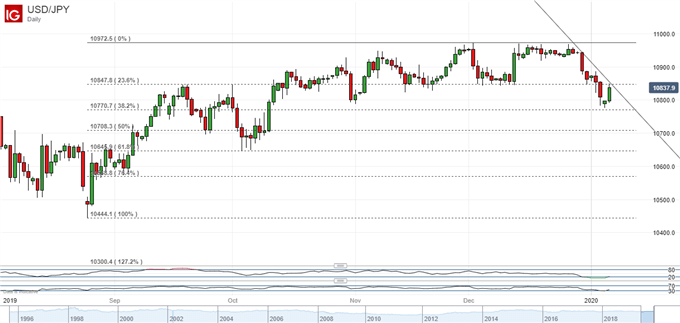
The Japanese Yen has surged against the US Dollar in 2020’s first week as rising tensions between the US and Iran have seen a general market move into perceived haven assets.

However, even before this steep slide began on December 25, USDJPY was showing signs of topping out, having risen gradually since August. Optimism over a US-China trade deal reignited global growth hopes and sapped demand for the counter-cyclical Yen.
Resistance in the 109.68 area had contained bullish impulses all through December. Now it’s important to note that, prior to the Iran story’s eruption, risk appetite had been pretty strong. While that key resistance level held, the uptrend looked solid and there seems little reason to suppose that the current reversal is anything other than a flight to safety.
For now the pair looks trapped between the first and second Fibonacci retracements of the rise up from August’s lows. These come in at 108.48 and 107.71, respectively. Short-term direction will probably depend on which of these breaks, with Dollar bulls back in the ascendant for the past two days.
Longer Term USDJPY Downtrend Looks Safe
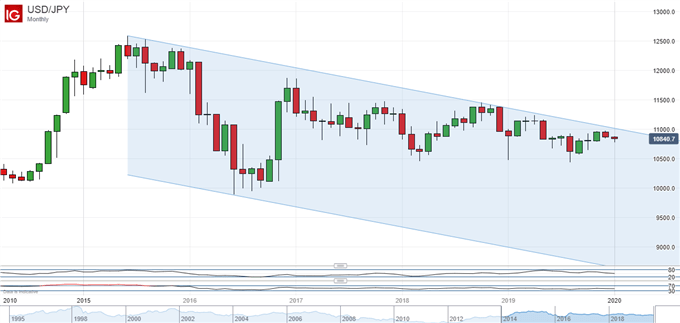
The Japanese Yen appears to be in a more commanding position if a longer view is taken.
The downtrend channel in place since 2015 on the monthly chart has held despite the pair spending much of 2019 close to its upper boundary.

The fate of this channel will clearly be of interest as 2020 trade gets under way, but a break seems most unlikely while Iran dominates the headlines.
NZD Down But Not Out
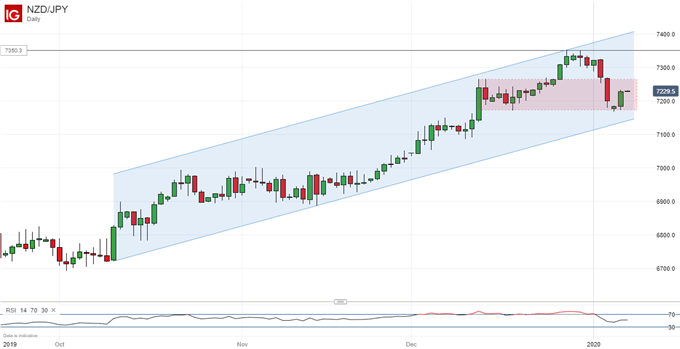
The New Zealand Dollar has displayed similar characteristics to its US cousin against the Japanese unit in the past few days, however there are important differences which may suggest that the kiwi will prove resilient.

Firstly, the overall uptrend from last year’s lows has remained unthreatened by the initial sharp, ‘risk off’ slide seen between December 30 and January 3. Secondly the support zone formed between December 12 and 25 has contained bearish impulses so far.
Whether it continues to do so will clearly be very important for short-term NZDJPY direction. Its base comes in at 71.73 and a break of that on a daily closing basis might well presage further falls.
Japanese Yen Resources for Traders
Whether you’re new to trading or an old hand DailyFX has plenty of resources to help you. There’s our trading sentiment indicator which shows you live how IG clients are positioned right now. We also hold educational and analytical webinars and offer trading guides, with one specifically aimed at those new to foreign exchange markets. There’s also a Bitcoin guide. Be sure to make the most of them all. They were written by our seasoned trading experts and they’re all free.
Join our analysts for live, interactive coverage of all major Japanese economic data at the DailyFX Webinars. We’d love to have you along.
--- Written by David Cottle, DailyFX Research
Follow David on Twitter @DavidCottleFX or use the Comments section below to get in touch!


