


Talking Points:
- USD/CAD Technical Strategy: CAD strengthens on Oil, Watching 100-DMA 1.3298
- CAD tracking Oil after Poloz speech failed to provide new insight on Policy
- If you’re looking for trading ideas, unlock our Trading Guides here
The foe to CAD Bull’s has become a friend. Oil rose for the second day in a row on Wednesday after refinery usage data rose aggressively, signaling the US stockpiles may draw down and the market may begin to balance. The correlation of the Canadian Dollar to Crude Oil has risen recently after spending a few months disjointed.
As of Wednesday, March 29, 2017, Crude Oil has a 20-day rolling inverse relationship with USD/CAD and USD/MXN of -0.557 and -0.579 respectively. The inverse correlation shows us as Oil moves higher, USD/CAD and USD/MXN move lower, albeit not perfectly. Therefore, we should watch Oil to get a sense of what may happen next with USD/CAD. Currently, USOIL is trading near the 200-DMA, and a failure to break back above on a sustainable basis may lead to further upside in USD/CAD, which the current channel seems to favor.
Interested in Joining Our Analysts, Instructors, or Strategists For a Free Webinar? Register Here
The chart below of USD/CAD shows that we’re trading in the middle of a rising channel. The spot price of 1.3330 sits above the March 22 low support at 1.32635. Just below the March 22 low is the 50% retracement of the late January to March Range at 1.32517 followed by the 61.8% retracement at 1.31846. Such levels should be watched if Oil gains compound. The resistance in focus in the current move lower is the March 28 high of 1.3414.
The support that we’re watching also aligns with the Daily Ichimoku cloud that could provide a buying opportunity for traders with a focus on a continual move higher toward the March 9 high of 1.35349. The channel that has framed price action so well is drawn off the May extremes with internal lines at the 23.6, 50, & 78.6% point of the initial range with the same slope as the channel. The top of the prior range is the December 28 high of 1.3598, which would also be the beginning of the top quartile in the price range. The top quartile will be an appropriate focus if the ST momentum remains bullish and 2yr US/CA yield differentials begin to widen again. The top of the channel comes in near 1.3790.
A reversal below the proven support of 1.3050/150 would need to break to turn the technical view from neutral to bearish.
What Did The Analysts Learn After Trading Of All 2016? Click Here To Find Out
D1 USD/CAD Chart: Pullback In Rising Price Channel May Bring Opportunity
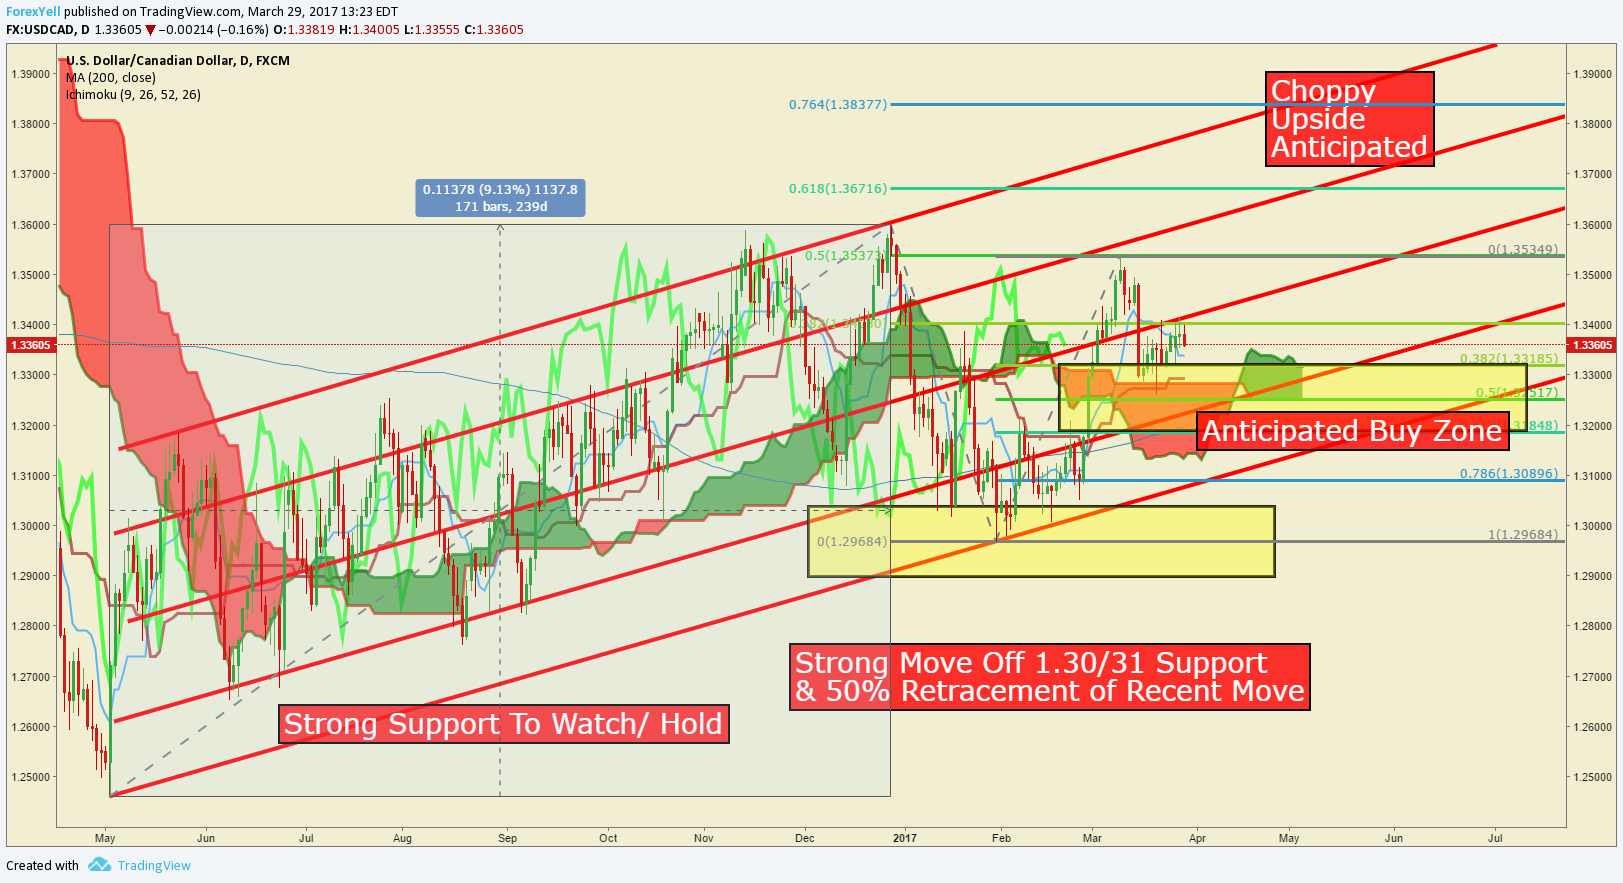
Chart Created by Tyler Yell, CMT

Retail trader data shows 42.1% of traders are net-long with the ratio of traders short to long at 1.38 to 1. The number of traders net-long is 3.7% lower than yesterday and 0.4% higher from last week, while the number of traders net-short is 2.4% lower than yesterday and 7.7% lower from last week.
We typically take a contrarian view to crowd sentiment, and the fact traders are net-short suggests USDCAD prices may continue to rise. Positioning is more net-short than yesterday but less net-short from last week. The combination of current sentiment and recent changes gives us a further mixed USDCAD trading bias.
---
Shorter-Term USD/CAD Technical Levels for Wednesday, March 29, 2017

For those interested in shorter-term levels of focus than the ones above, these levels signal important potential pivot levels over the next 48-hours of trading.
T.Y.


