


US Dollar, EUR/USD Price Action:
- US Dollar strength has held on, with buyers offering support above the 90.00 handle on DXY.
- Numerous drivers are ahead, including a number of Fed speakers offering commentary before tomorrow’s high-impact US data prints.
- The analysis contained in article relies on price action and chart formations. To learn more about price action or chart patterns, or the falling wedge shown in USD/CAD, check out our DailyFX Education section.
The US Dollar continues to grasp for support on longer-term charts following an aggressive sell-off that’s remained since the US election. And as looked at last week, a combination of oversold conditions along with a falling wedge and diverging RSI, the door was starting to open for a pullback in the US currency.
That’s since held through this week, including yesterday’s inflation data. Price action in the US Dollar is now showing an uneasy state of inertia, bound to break in one direction or the other as both bulls and bears jostle for control. To be clear, at this point the move does appear to be at least somewhat driven by a short-squeeze scenario. The pullback at this point has retraced approximately 23.6% of the post-Election sell-off, continuing to find resistance around the 90.50 level in DXY.

On the driver side of the equation – tomorrow brings a couple of high-impact US prints and this follows this morning’s disappointment employment data. Also of consideration – a speech from Chair Powell looms for later this afternoon, amongst a host of other Fed speakers, as outlined by our own Justin McQueen earlier today.
DailyFX Economic Calendar: High-Impact Data Due on Jan 15, 2021
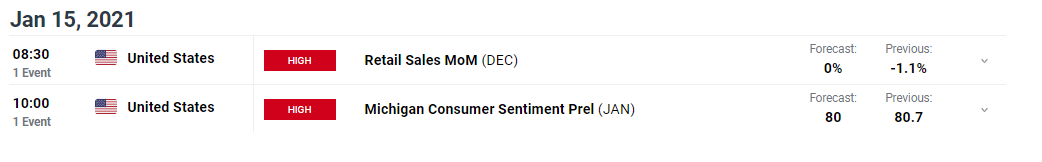
Taken from the DailyFX Economic Calendar
At this point, the US Dollar is building a short-term symmetrical triangle following the break from the longer-term falling wedge. And despite both formations being driven by digestion, the approach for each can be dramatically different: With a falling wedge, the aim is often to look for reversals whereas a symmetrical triangle doesn’t necessarily offer the same type of prior directional bias and, as such, will often be approached with the aim of breakouts in either direction.
To learn more about triangle patterns, join us in DailyFX Education
US Dollar Four-Hour Price Chart
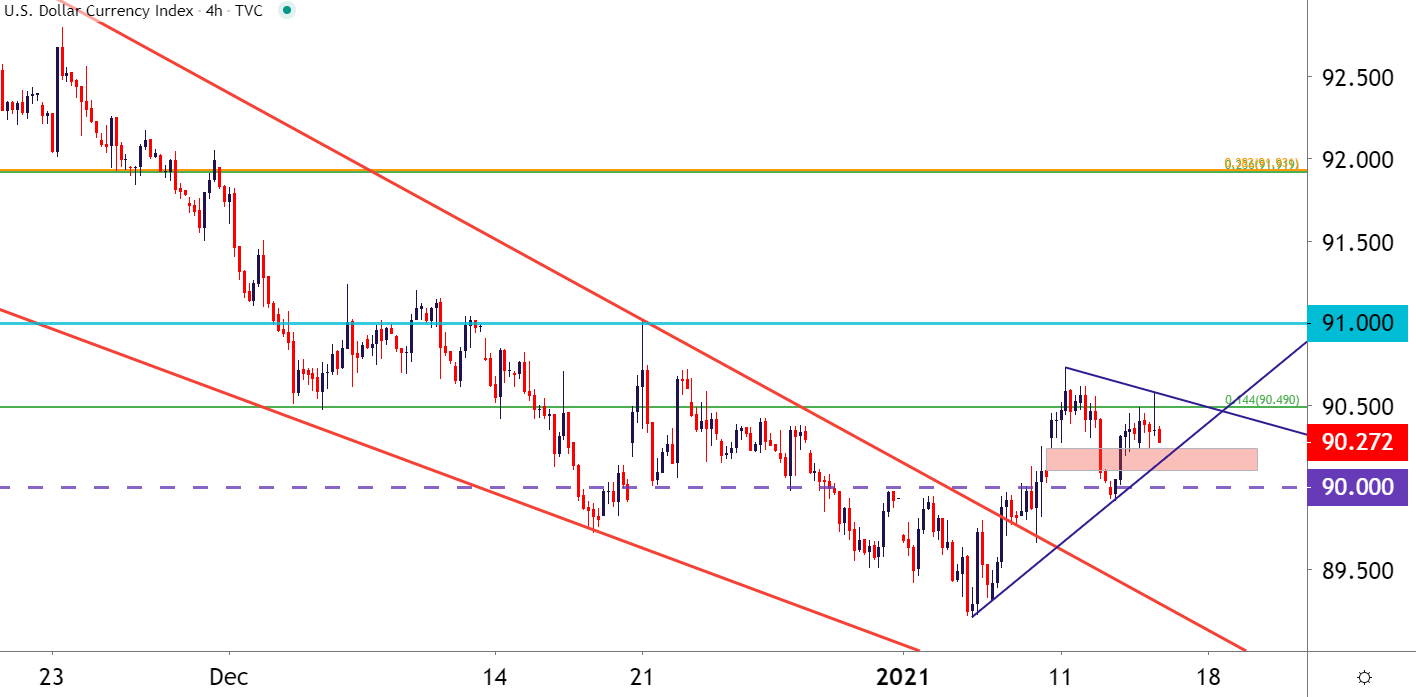
Chart prepared by James Stanley; USD, DXY on Tradingview
EUR/USD Drops to Fresh Monthly Low, Slips Below Big Support
Going along with this pullback in the US Dollar has been a similar theme in EUR/USD. The big area on the chart of EUR/USD appears to be around 1.2134-1.2167, as each of those prices are derived from longer-term Fibonacci studies. This creates a 33 pip zone that’s been in-play in multiple manners since early-December, first functioning as resistance and then support. This zone has come back as support again this week as USD-bulls have continued to push.
For those that are looking for a prolonged bout of USD-strength, the short-side of EUR/USD can remain as an attractive venue, looking for the pair to push down towards a re-test of the 1.2000 psychological level which, after providing some stern resistance when EUR/USD prices were on the way up, but has yet to be tested for support.
To learn about the importance of psychological levels, join us in DailyFX Education
EUR/USD Daily Price Chart
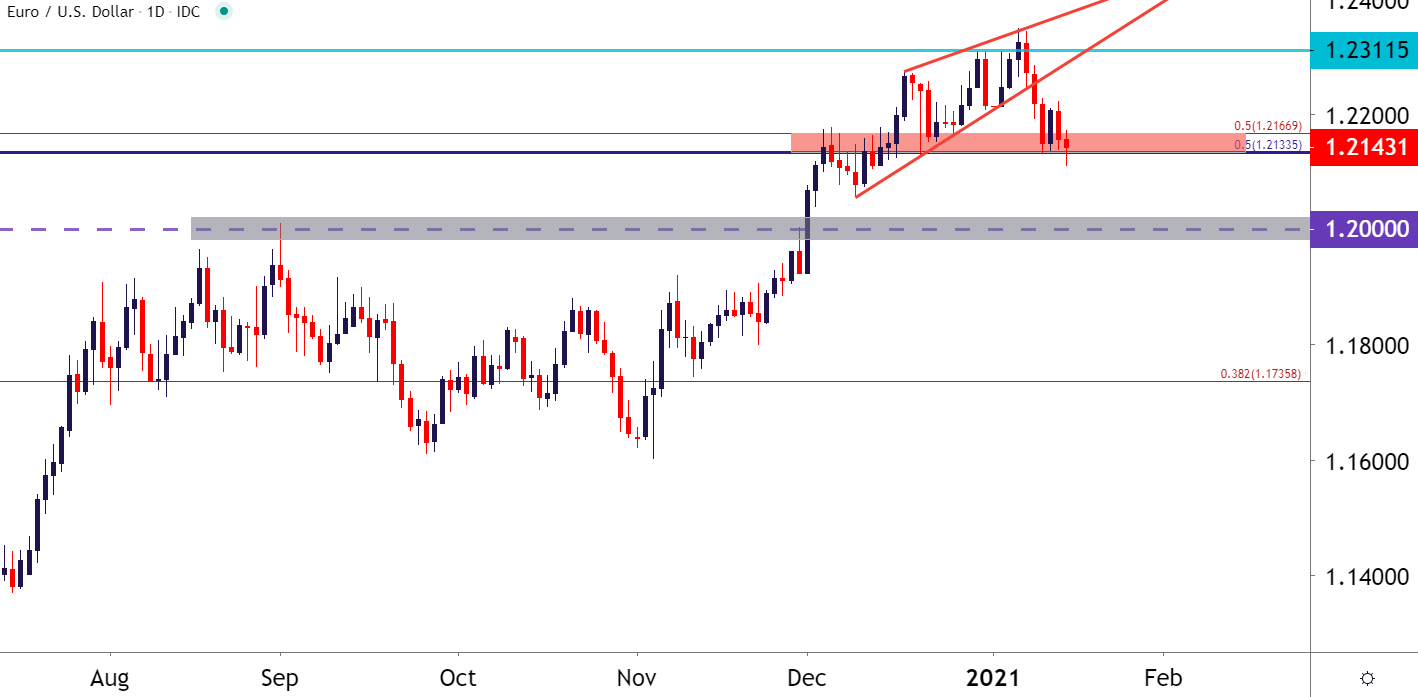
Chart prepared by James Stanley; EURUSD on Tradingview
--- Written by James Stanley, Strategist for DailyFX.com
Contact and follow James on Twitter: @JStanleyFX


