


FTSE 100 Slides As BP Reports A Loss of £6.5bn
The FTSE 100 has given up 76.4% of its latest bull leg from Thursday’s low of 5886, as crude oil slides andBP reports a loss of £6.5bn, its worst annual loss in 20 years.
While the FTSE 100 is lower over the last two days the overall trend is still bullish above Thursday’s low of 5886 and it makes little sense to turn bearish at current levels. Price needs to break 5886 for the trend to turn bearish. In this case the FTSE 100 might reach the January 26 low of 5773.
We note the market is no longer overbought in relation to commodities and the DAX, something it was when trading at 6127. The DAX suggests the FTSE 100 should be trading at 5976, while the Bloomberg Commodity index suggests it should be at 6004.
U.S. ISM Mfg. Shows Tentative Signs of a Reversal
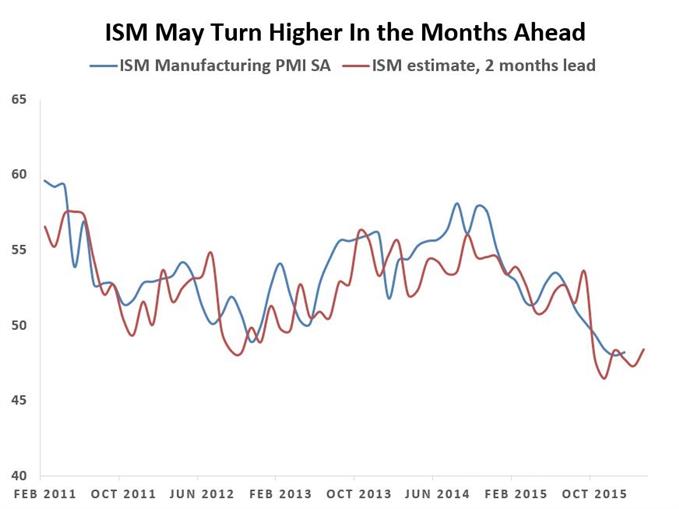
Another reason suggesting it may a bit early to turn bearish is Monday’s ISM report. While it failed to meet expectations by printing 48.2 vs. an est. 48.5, new orders increased to 51.5 from 48.8 while Customer inventories remained unchanged at 51.5. These leading components suggest that manufacturing may be in the process of stabilizing, please see below chart. If this indeed happens then it may pave the way for increased risk-appetite, e.g. stronger stock markets, stable commodities, and a stronger Dollar.
Please note that in October we used the same model to forecast a decline in the ISM, well before the general public.
Improve your chances of success by picking up one of our 16 different Trading Guides
FTSE 100 | FXCM: UK100

Created with Marketscope/Trading Station II; prepared by Alejandro Zambrano
--- Written by Alejandro Zambrano, Market Analyst for DailyFX.com
Contact and follow Alejandro on Twitter: @AlexFX00
Struggling with Trading? Join a London Seminar


