


U.S. Indices Technical Highlights:
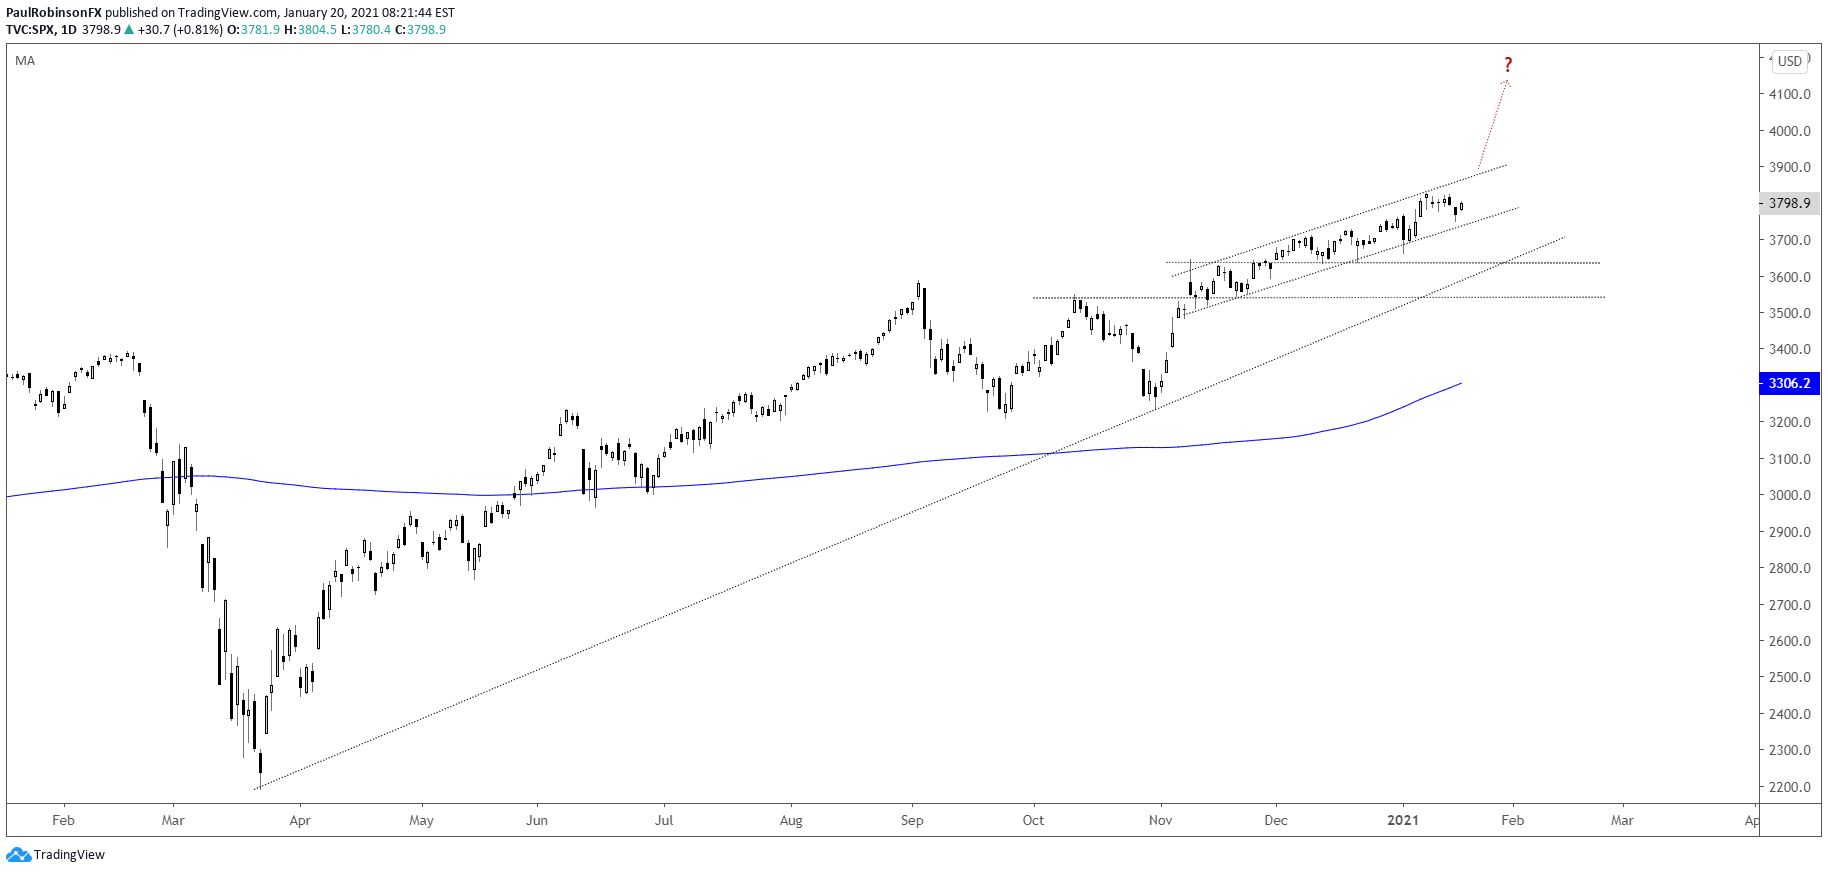
- S&P 500 continues to work its way higher within a channel
- Dow Jones treading water in record territory
- Nasdaq 100 trending within confines of neat upward structure
SPX, Dow, NDX continue to look headed higher
The S&P 500 continues to look bullish with price trending higher within the confines of a neat upward channel structure. These patterns can act as excellent guides for shaping a trading bias whether looking to get long/stay long, or get short/stay short.
As long as price stays within the confines of the upward channel or exceed the upper threshold, then the market has a bullish bias. It is when the lower threshold is broken and price starts to buck the trend that the market may be on the cusp of a trend reversal.
How high the SPX can trade is hard to say given it is in record territory. On the downside, should the lower parallel get breached, look for price to potentially drop back towards the March trend-line in the low 3600s.

S&P 500 Daily Chart (staying with the channel)
The Dow Jones is trying to hang onto the top portion of its own upward channel. The notable line of resistance from June is helping keep a ceiling in for now. This was noted last week as having potential to act as resistance, and could continue to keep the upside in check in the near-term.
First, a breakout above the most recent record high at 31193 is needed before the upper trend-line can be tested again. On the downside, should a little near-term weakness set in, the lower parallel of the channel will be first viewed as support. If it breaks, then the bias may turn negative towards the March trend-line.
Dow Jones Daily Chart (top-side trend-line acting as resistance)
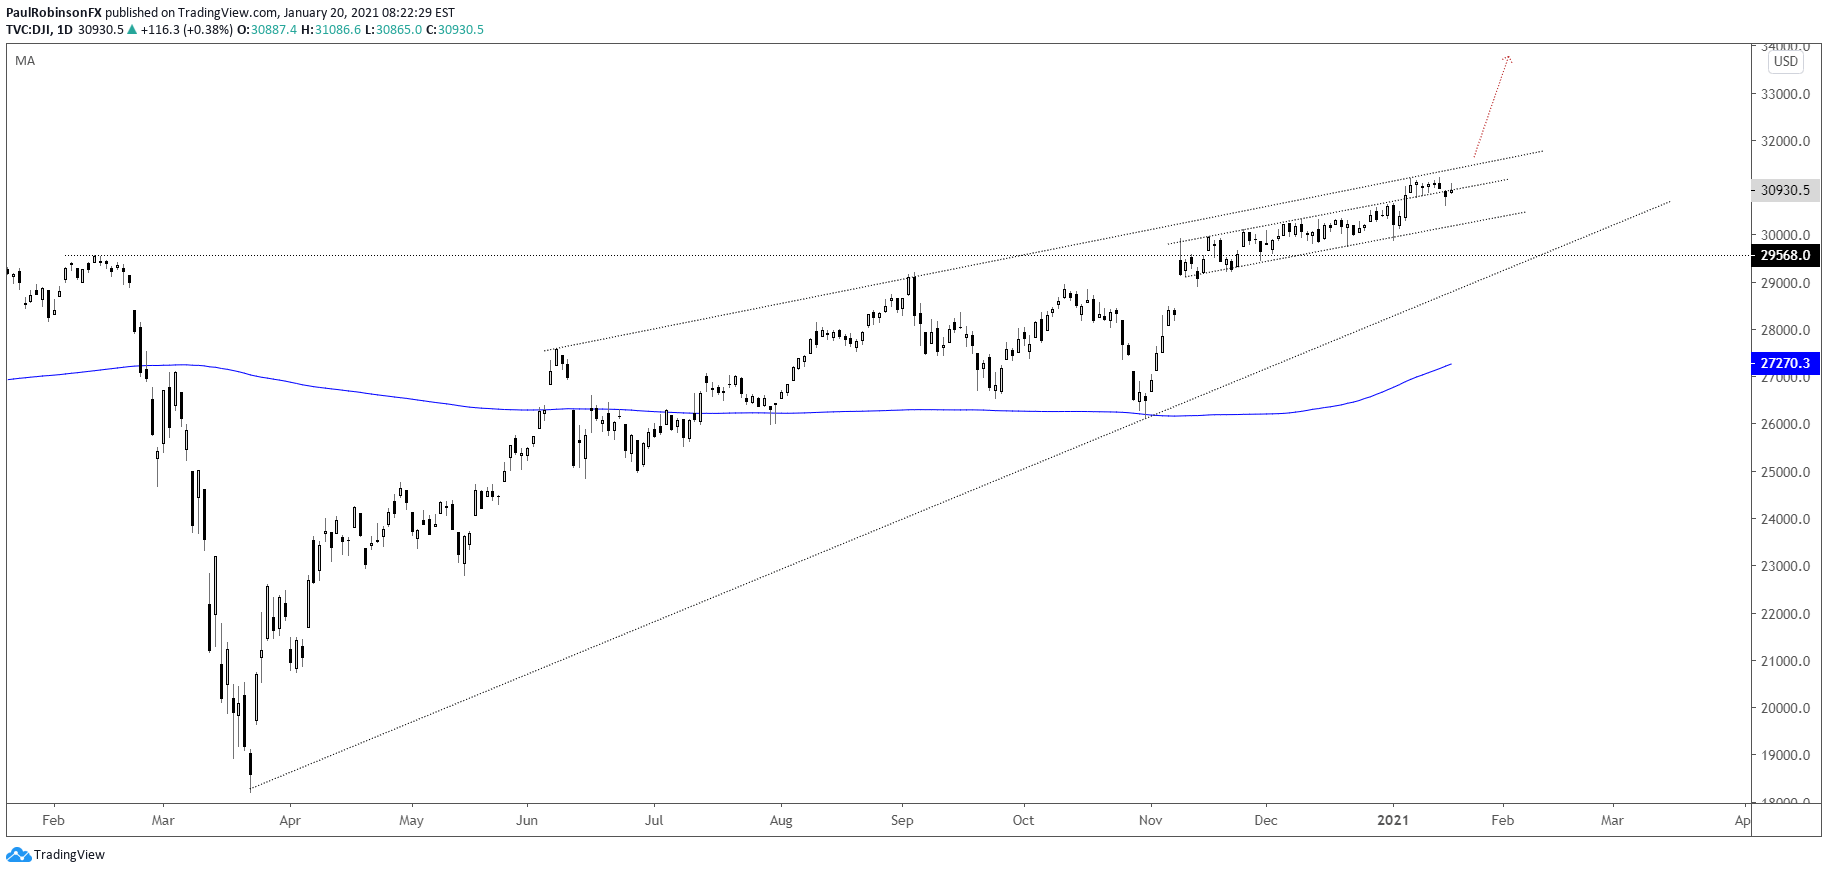
Dow Jones Chart by TradingView
The Nasdaq 100 has a very nice channel structure nearly identical to that of the S&P 500. The story here is the same, stay inside or above the upper parallel and the outlook is for higher prices. Break below the lower parallel and things could turn bearish. Not far below the channel, though, is the March trend-line. This line of support could be quick to put in a floor if tested and held.
Nasdaq 100 Daily Chart (looking higher for now)
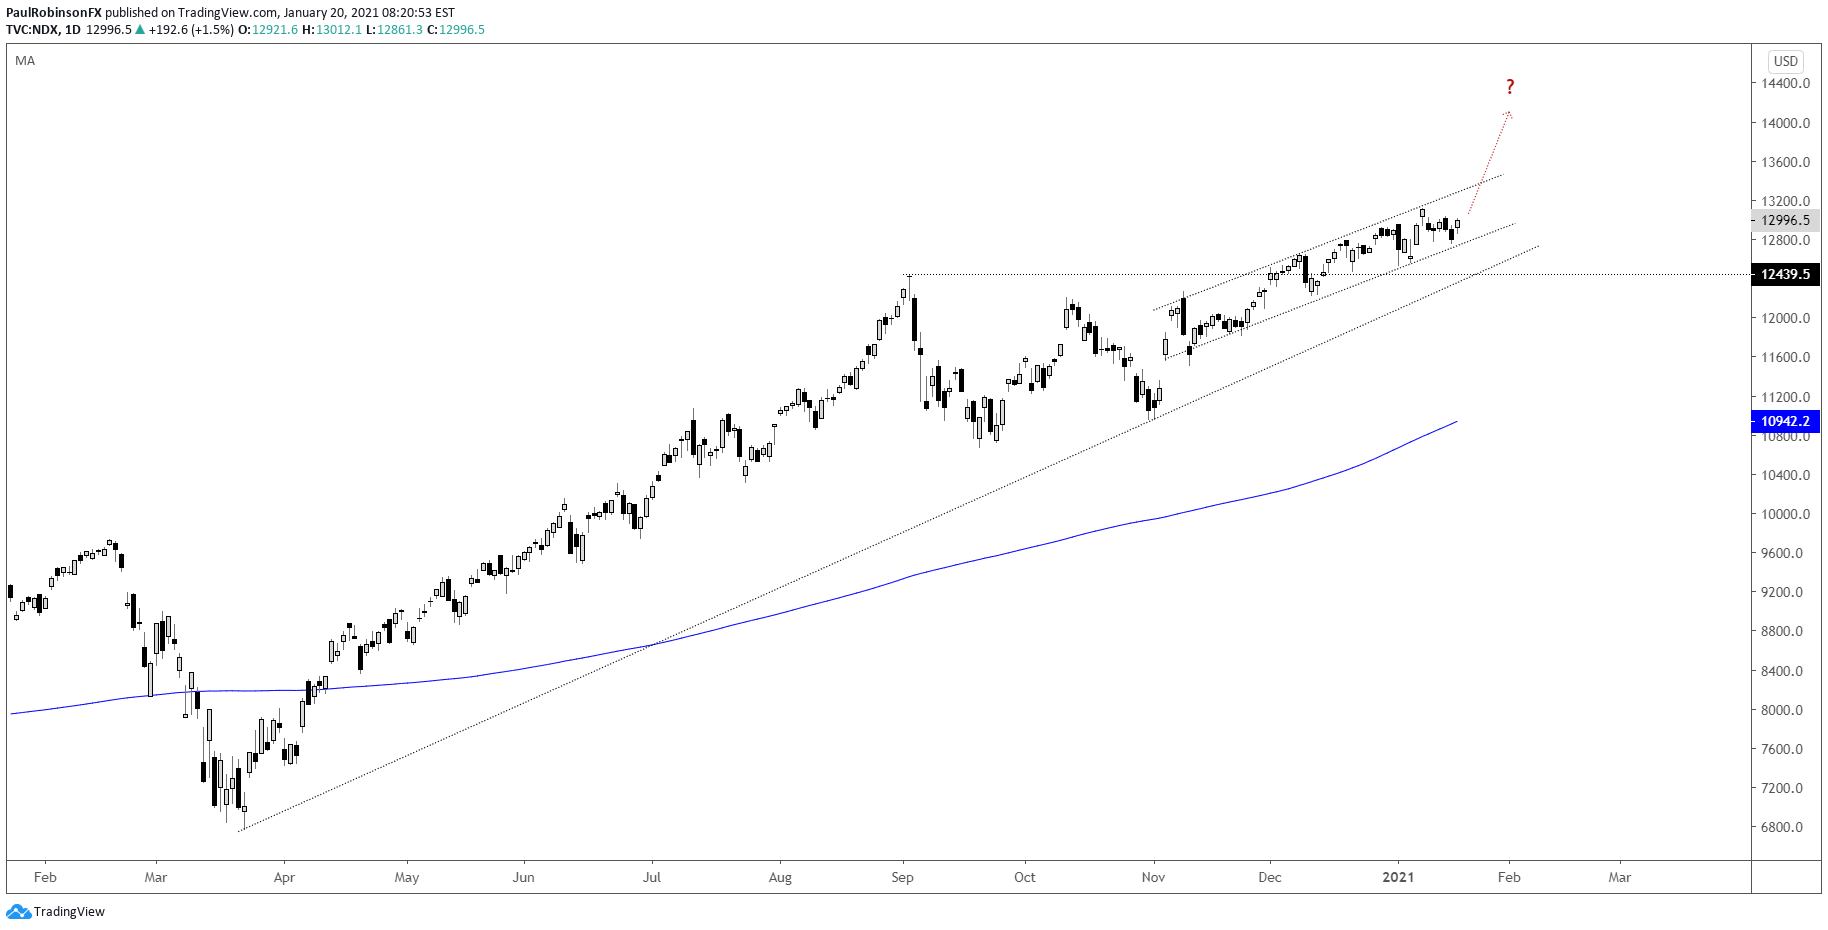
Nasdaq 100 Chart by TradingView
Resources for Forex Traders
Whether you are a new or experienced trader, we have several resources available to help you; indicator for tracking trader sentiment, quarterly trading forecasts, analytical and educational webinars held daily, trading guides to help you improve trading performance, and one specifically for those who are new to forex.
---Written by Paul Robinson, Market Analyst
You can follow Paul on Twitter at @PaulRobinsonFX


