


What’s inside:
- S&P 500 rallies sharply after big Monday gap-down
- Trading up against resistance zone
- Hourly chart in focus
New to the markets, or simply looking for trader education? See our Trading Guides.
In Monday’s piece, we had this to say about the gap-down open: “As long as we don’t see a ‘gap-n-trap’ buy situation which erases a significant portion of today’s losses and then some, we are looking to the area around 2300 as the near-term target.” The gap-down buy was exactly what we saw, especially in the Nasdaq 100, which now sits in close proximity to a new record closing print.
The first two days of the week have brought a nice rebound, but was Monday the low, ending a correction? The overall trend is pointing upward, and dips, or corrections, should be relatively short-lived – at least in terms of price (time corrections can take a while). But it seems a bit premature to say the market is in the all-clear just yet.
Looking at the short-term, the S&P is squared up against a trough created earlier in the month, and needs to clear above if it is to touch off the trend-line running down from the record high created on 3/1.
S&P 500: Daily

Created with TradingView
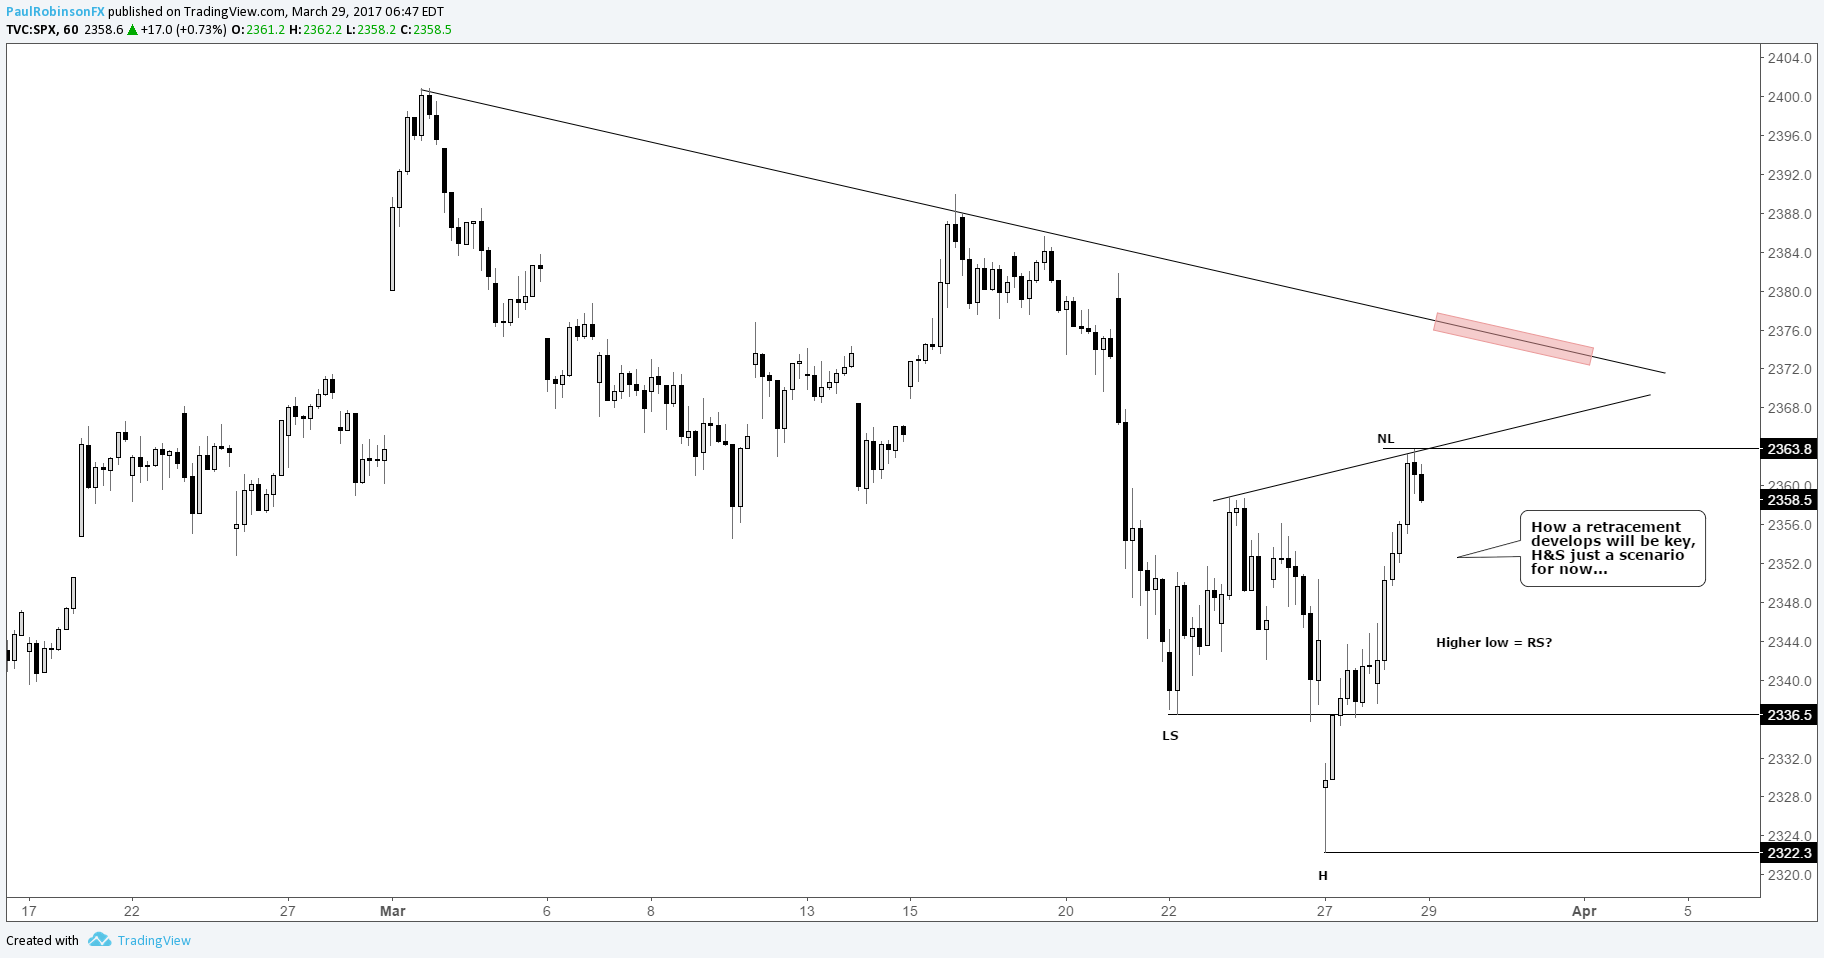
Pulling in closer to the hourly chart, a pullback from current levels and higher low could create a bullish inverse head-and-shoulders set-up. But this is only a scenario, however; given this week’s gap-down and surge higher it would be reasonable to conclude that a higher low could develop and another thrust higher unfold thereafter. In this scenario, we would look for the top-side trend-line over 2370 as the next line of contention.
A drop below 2336 and it would become likely the Monday low will come under fire, and possibly worse. In summary, a pullback is the first expected move – how the market reacts on any decline which may unfold very soon will be the tell moving forward. As they say – ‘much can be learned in the retracement.’
S&P 500: Hourly
Created with TradingView
See the Webinar Calendar for a schedule of upcoming live events with DailyFX analysts.
---Written by Paul Robinson, Market Analyst
You can receive Paul’s analysis directly via email by signing up here.
You can follow Paul on Twitter at @PaulRobinonFX.


