


NZD/USD Technical ANALYSIS: BEARISH
- Near-term NZ Dollar bottom suggested by bullish H&S pattern
- Any implied gains likely to be corrective within broader decline
- Four-hour chart warns H&S setup may fail before confirmation
Get help building confidence in your NZD/USD strategy with our free trading guide!
The New Zealand Dollar may be carving out a bottom against its US counterpart. Prices seem to be tracing out a bullish Head and Shoulders (H&S) reversal pattern having tested four-year support in the 0.6197-0.6268 area. Positive RSI divergence points to ebbing selling pressure, bolstering the case for gains.
A daily close above the H&S pattern’s neckline at 0.6349 would confirm the setup, implying a measured upside objective near the 0.65 figure. Critically, that would leave intact the dominant downtrend from July 2017, suggesting the chart setup is telegraphing a corrective bounce rather than a change of trend.
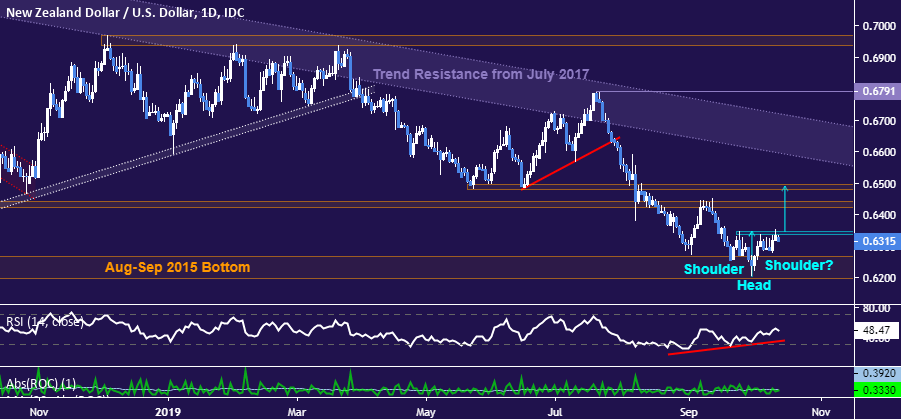
Daily NZD/USD chart created using TradingView
Shorter-term signaling on the four-hour chart might be still more troubling for NZD buyers. Negative RSI divergence has emerged as prices test H&S neckline resistance, implying a loss of momentum. If this is followed by a break back below the 0.6275-87 support shelf, bottoming cues might be neutralized.
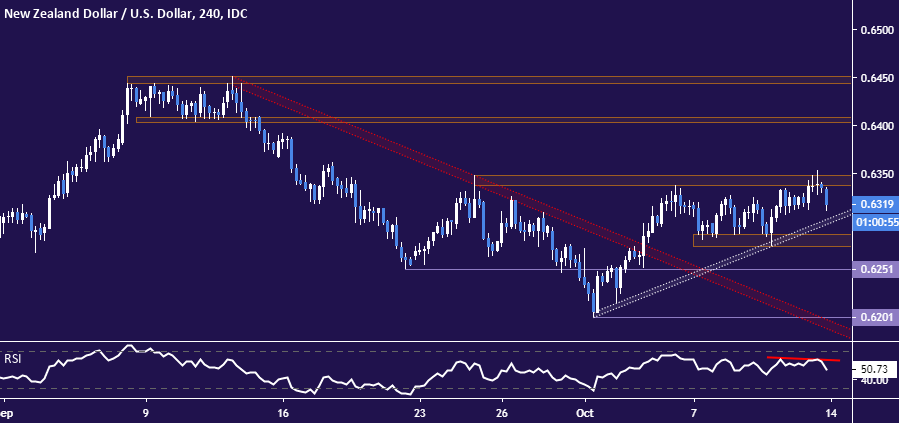
4-hour NZD/USD chart created using TradingView
Zooming out to the monthly chart offers yet more perspective. Downside progress has understandably stalled ahead of the long-standing 0.5914-0.6197 inflection zone, but this follows a break of 19-year support. Invaliding that structurally bearish development calls for a seemingly distant return above 0.69.
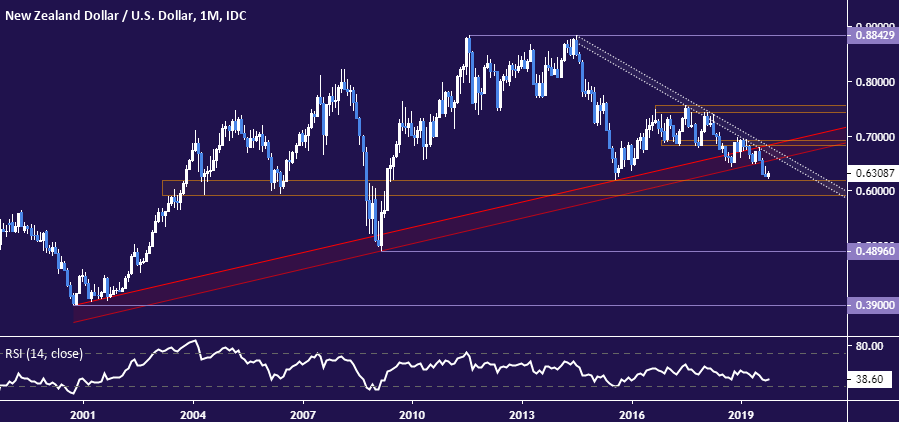
Monthly NZD/USD chart created using TradingView
NZD/USD TRADING RESOURCES:
- Just getting started? See our beginners’ guide for FX traders
- Having trouble with your strategy? Here’s the #1 mistake that traders make
- Join a free live webinar and have your trading questions answered
--- Written by Ilya Spivak, Currency Strategist for DailyFX.com
To contact Ilya, use the Comments section below or @IlyaSpivak on Twitter


