


Nikkei 225 Technical Analysis Talking Points:
- The Nikkei 225 is near 8-month peaks
- Beyond them this year’s ten-year highs beckon again
- However some base building may be needed if they’re to break sustainably
Get trading hints and join our analysts for interactive live coverage of all major economic data at the DailyFX Webinars.
The Nikkei 225 has pushed on to new, eight month-peaks despite the fundamental backdrop of global trade friction from which Japan would hardly seem immune on any count.
Still, US equity’s vigor has been contagious, while a weaker Japanese Yen has boosted the allure of local stocks to overseas investors.
So much for the fundamentals. Technically the Tokyo stock benchmark has risen sharply above even the strong, prevalent uptrend line which has been in place since the lows of May. Thanks to the soaring gains seen since September 12, that line is now fully 1,500 points below current market levels.
The bulls clearly have theirs sights set once again on the year’s peaks. They were made in January, in the 24,200 region, which is once again within clear striking distance. However, they were ten-year highs so what lies beyond them will be uncharted territory for many investors. Further gains above that point may very well be more cautious than the breakneck rises we have seen over the past three weeks.
Moreover, with the index looking rather stretched now- as well it might after such a forceful up-move-, it may be time for a little pause.
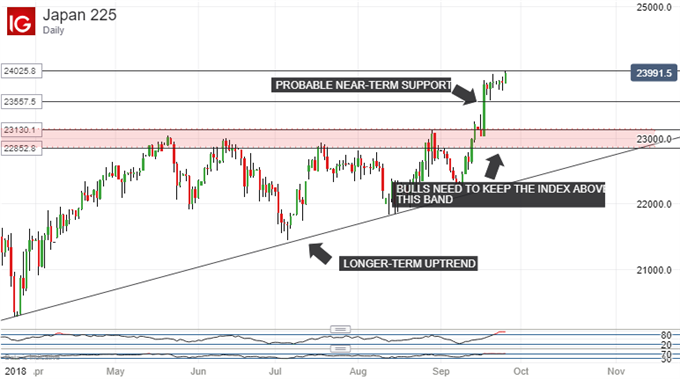
Any short-term pullback will probably find support in the 23,558 area, which has contained the bears for the past week or so. However, even if that gives way, the consolidation theory will probably remain believable for as long as the index remains above the band of support in red on the chart above. It comes in between 23,130 and 22,852. Interestingly it represents not just a cluster of key levels from the previous peak, made in last August, but also from the tops of July, June and May this year.
The bulls will probably remain in charge for as long as the index can hang on above this band on a daily and,importantly, a weekly closing basis. If they can’t then a retreat back down to that long-term downtrend line can’t be ruled out, even if it looks very likely to hold when tested.
Resources for Traders
Whether you’re new to trading or an old hand DailyFX has plenty of resources to help you. There’s our trading sentiment indicator which shows you live how IG clients are positioned right now. We also hold educational and analytical webinars and offer trading guides, with one specifically aimed at those new to foreign exchange markets. There’s also a Bitcoin guide. Be sure to make the most of them all. They were written by our seasoned trading experts and they’re all free.
--- Written by David Cottle, DailyFX Research
Follow David on Twitter @DavidCottleFX or use the Comments section below to get in touch!


