


ASX 200 Technical Analysis Talking Points:
- The Australian stock benchmark has retreated a little
- But it’s too early to say that the bulls have lost control
- Even the first Fibonacci retracement of this year’s gains comes in some way below the market
Find out what retail foreign exchange traders make of the Australian Dollar’s chances right now at the DailyFX Sentiment Page.
The ASX 200 has given back some of the gains which took it up to the 2019’s highs so far late last month.
Fundamentally speaking risk aversion has been dealt a heavy blow by this week’s news of apparently rising trade tensions between the US and China.
Things don’t look too serious for the bulls yet, however. Admittedly the former trading range is in danger of a downside break but its not conclusive. A daily or weekly close below 6297 would make it so, however, and that is hardly impossible at current levels.
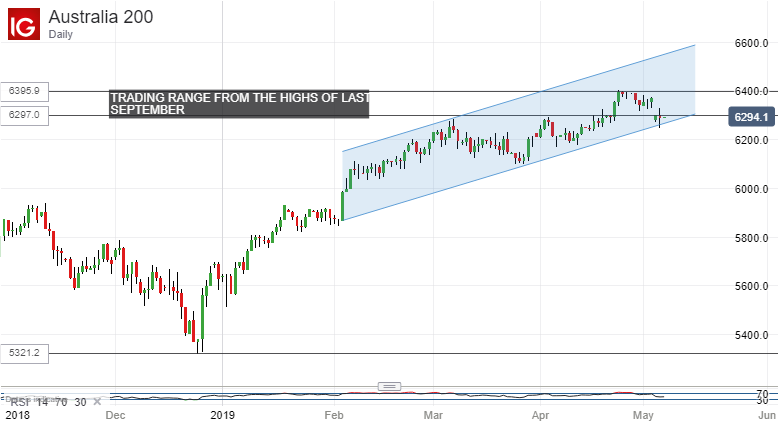
Still, even should it occur, even the first Fiboancci retracement of this year’s rise doesn’t come in until 6146, a good 150 points below current levels. Of course, a fall that far would be more serious for the bulls because it would certainly entail a break of the currently dominant uptrend.
Indeed, that prospect looks to be very likely with the index virtually on that uptrend line now. There does seem to be some danger of a head and shoulders pattern forming on this chart, with the shoulder at April 3’s highs. That of course is a ‘topping out’ pattern which would suggest that the bulls were exhausted. However, there are plentiful fundamental risk sources out there at the moment, and a broad revival in risk appetite may yet see the index headed higher again.
Momentum indicators such as the Relative Strength Index certainly don’t suggest that the bulls are exhausted.
Still, it is worth looking also at the monthly chart and that might be sounding a note of caution.
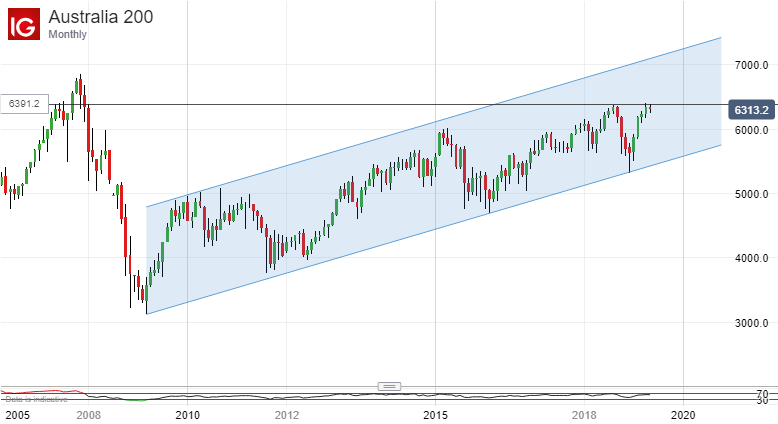
It’s by no means a sharp note yet. The index is clearly still well within the uptrend channel which has held good since the financial crisis’ grip started to weaken in 2009. Still, that channel has not had a serious upside test since its inception, and the index may be in some danger of forming a double top now, commensurate with the highs of last July.
In the short-term the bulls may still have some fight left in them, but this chart will bear watching from here as the year progresses.
Resources for Traders
Whether you’re new to trading or an old hand DailyFX has plenty of resources to help you. There’s our trading sentiment indicator which shows you live how IG clients are positioned right now. We also hold educational and analytical webinars and offer trading guides, with one specifically aimed at those new to foreign exchange markets. There’s also a Bitcoin guide. Be sure to make the most of them all. They were written by our seasoned trading experts and they’re all free.
--- Written by David Cottle, DailyFX Research
Follow David on Twitter @DavidCottleFX or use the Comments section below to get in touch!


