


US Dollar, USD/SGD, USD/PHP, USD/MYR, USD/IDR – ASEAN Technical Analysis
- US Dollar may be at risk to some of its ASEAN counterparts
- USD/SGD, USD/PHP, USD/MYR, USD/IDR breakouts eyed
- What are unique aspects of trading foreign exchange markets?
The US Dollar could be at risk to further losses against some of its ASEAN counterparts such as the Singapore Dollar, Philippine Peso, Malaysian Ringgit and Indonesian Rupiah. On the daily chart below, my ASEAN-based USD index (which averages it against SGD, PHP, MYR and PHP) confirmed a break under key support. The latter is a range between 4.1537 – 4.1638. Now prices are testing the next formidable barrier which is an inflection point between 4.1223 – 4.1318. Could this be a turning point or downtrend resumption?

ASEAN-Based US Dollar Index – Daily Chart
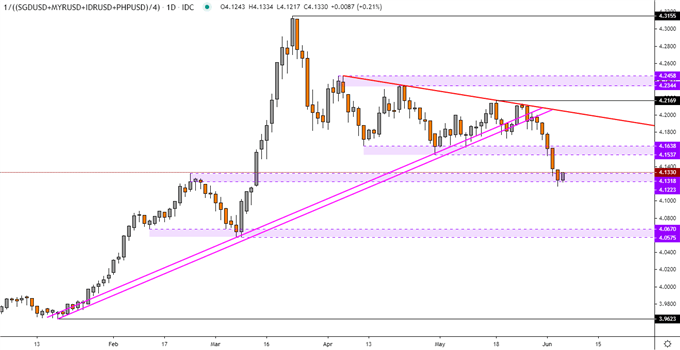
ASEAN-Based USD Index Chart Created in TradingView
*My ASEAN-Based USD Index Averages USD/SGD, USD/PHP, USD/MYR and USD/IDR
Singapore Dollar Technical Outlook
The Singapore Dollar has exited its consolidative setting after USD/SGD confirmed a break under support (1.4113 – 1.4070). That has opened the door to resuming the top from late March with prices appearing to face the 61.8% Fibonacci retracement at 1.3902. Falling through the latter then exposes March lows (1.3760 – 1.3778). Invalidating the downside breakout entails pushing back above 1.4113 towards 1.4278.
USD/SGD Daily Chart
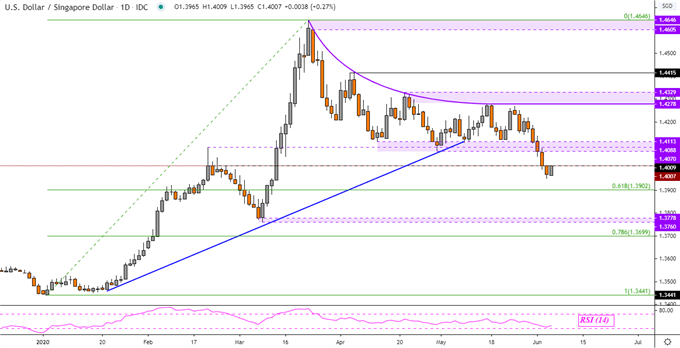
USD/SGD Chart Created in TradingView
Philippine Peso Technical Outlook
The Philippine Peso appears to have confirmed a downside breakout through key support (50.38 – 50.52). This momentarily sent USD/PHP below 50 for the first time since January 2018 and represents a potential change in pace since November. The pair also closed under the 50.12 – 50.19 barrier, exposing the 2018 low at 49.73. For now, prices seem to be idling around the midpoint of the Fibonacci extension at 49.99. Closing under the 2018 low exposes the 78.6% extension at 49.41.
USD/PHP Daily Chart
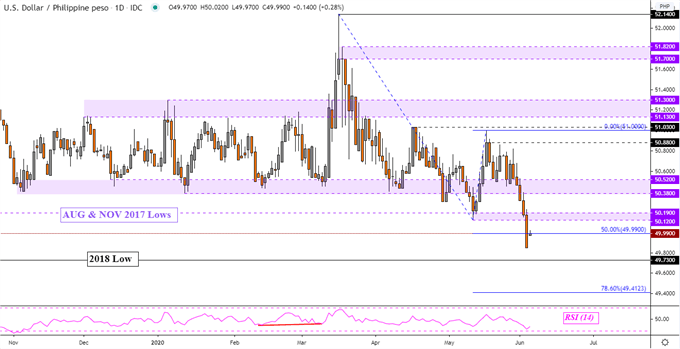
USD/PHP Chart Created in TradingView
Malaysian Ringgit Technical Outlook
The Malaysian Ringgit has extended its appreciation against the US Dollar after USD/MYR closed under key rising support from January – blue line on the daily chart below. This has left the pair facing the former high from October 2017 at 4.2425 which may stand in the way as support next. Closing under this price exposes the March low at 4.1600. Invalidating the breakout may entail pushing above former support which could stand in the way as new resistance between (4.2930 – 4.3030) on the daily chart below.
USD/MYR Daily Chart
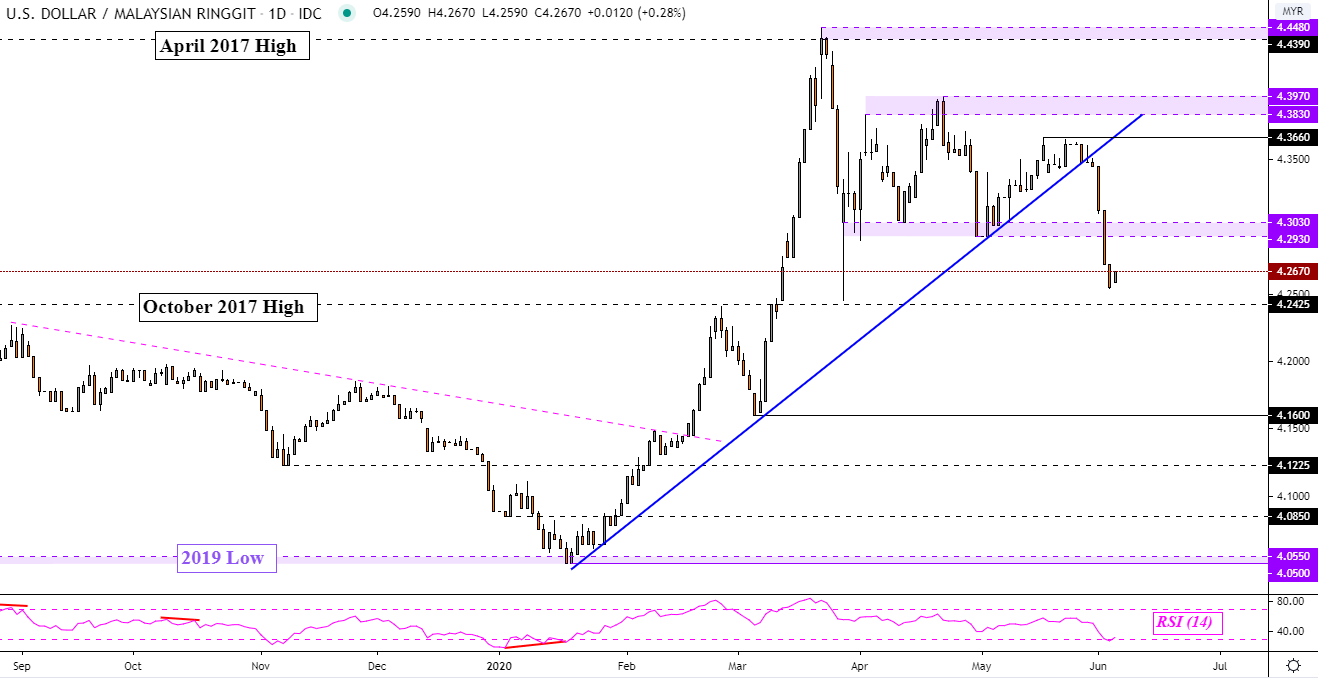
USD/MYR Chart Created in TradingView
Indonesian Rupiah Technical Outlook
The Indonesian Rupiah has recently aggressively appreciated against the US Dollar. Over two days, USD/IDR took out the 61.8% Fibonacci retracement (14773) and former highs from May 2019. Now the pair is attempting to clear the 78.6% retracement at 14240 which if taken out, exposes the inflection point between 13848 – 13895. As I mentioned recently, the Bank of Indonesia has been actively intervening to stabilize the Rupiah. As such, the central bank may step up efforts to quell USD/IDR gains in the medium term.
USD/IDR Daily Chart
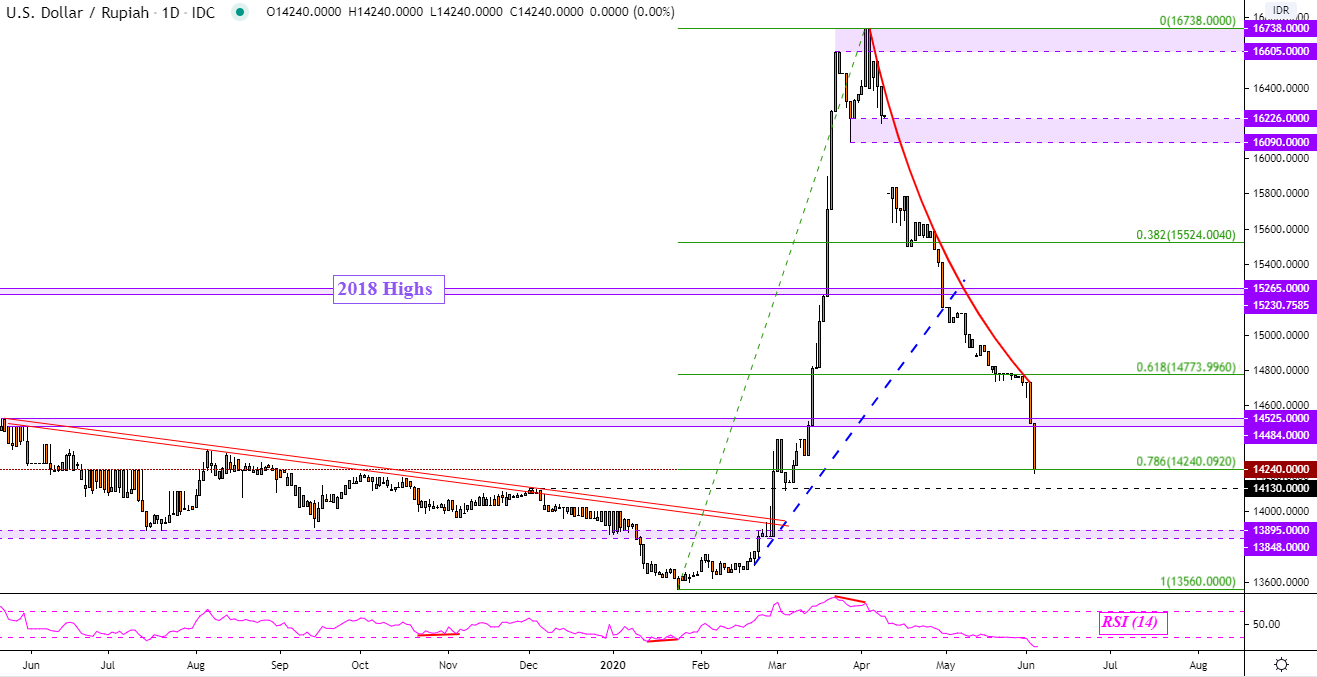
USD/IDR Chart Created in TradingView
--- Written by Daniel Dubrovsky, Currency Analyst for DailyFX.com
To contact Daniel, use the comments section below or @ddubrovskyFX on Twitter


